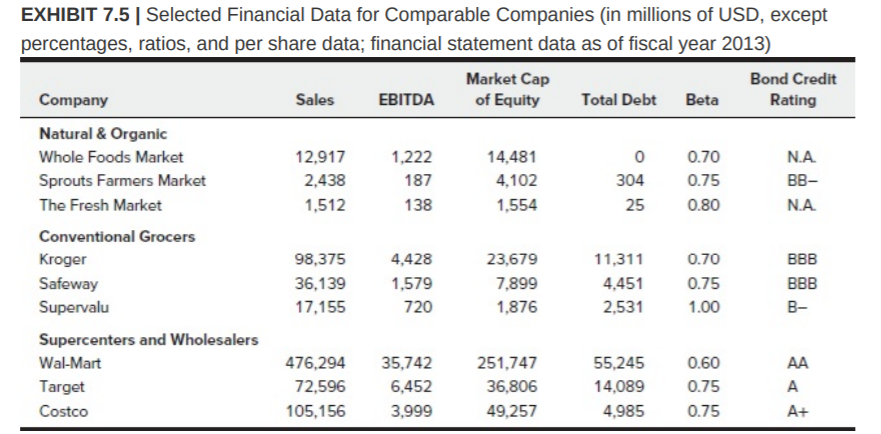
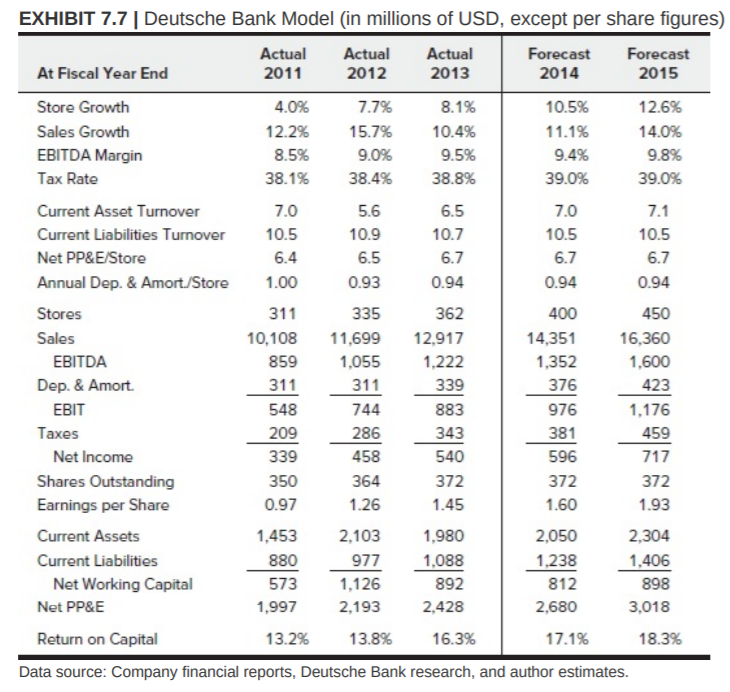
 Using peer information provided in Exhibit 7.5, what is forecast WFM Market Cap of Equity for 2014 if we use the implied value - mean EBITDA multiple approach and forecast information in Exhibit 7.7? Round and enter nearest million.
EXHIBIT 7.5 Selected Financial Data for Comparable Companies (in millions of USD, except percentages, ratios, and per share data; financial statement data as of fiscal year 2013) Market Cap of Equity Bond Credit Rating Company Sales EBITDA Total Debt Beta 1,222 0 Natural & Organic Whole Foods Market Sprouts Farmers Market The Fresh Market 12,917 2,438 1,512 187 14.481 4,102 1,554 0.70 0.75 0.80 NA BB- NA 138 Conventional Grocers Kroger Safeway Supervalu 98,375 36,139 17,155 35,139 1.5797,399 4,428 1,579 720 23,679 7,899 1,876 11,311 4,451 2,531 4,451 0.75 0.70 0.75 1.00 BBB BBB B- Supercenters and Wholesalers Wal-Mart Target Costco 476,294 72,596 105,156 35,742 6,452 3,999 251,747 36,806 49.257 55,245 14,089 4,985 0.60 0.75 0.75 EXHIBIT 7.7 Deutsche Bank Model (in millions of USD, except per share figures) At Fiscal Year End Actual 2011 Actual 2012 Actual 2013 Forecast 2014 forecast 2015 Store Growth Sales Growth EBITDA Margin Tax Rate 4.0% 12.2% 8.5% 38.1% 7.0 7.7% 15.7% 9.0% 38.4% 8.1% 10.4% 9.5% 38.8% 10.5% 11.1% 9.4% 39.0% 12.6% 14.0% 9.8% 39.0% 7.0 7.1 6.5 10.7 mover 10.5 10.5 5.6 10.9 6.5 0.93 10.5 6.7 6.7 6.4 1.00 6.7 0.94 0.94 0.94 Current Asset Turnover Current Liabilities Turnover Net PP&E/Store Annual Dep. & Amort./Store Stores Sales EBITDA Dep. & Amort. 311 362 12,917 1.222 339 400 14,351 1,352 450 16,360 1,600 423 1.176 459 376 976 EBIT 883 343 381 596 717 Taxes Net Income Shares Outstanding Earnings per Share 10,108 859 311 548 209 339 350 0.97 1,453 880 573 1,997 13.2% 335 11,699 1.055 311 744 286 458 364 1.26 2,103 977 1,126 2,193 13.8% 372 372 1.93 1.60 Current Assets Current Liabilities Net Working Capital Net PP&E 540 372 1.45 1.980 1,088 892 2,428 16.3% 2.050 1,238 812 2,680 2,304 1,406 898 3.018 18.3% Return on Capital 17.1% Data source: Company financial reports, Deutsche Bank research, and author estimates. EXHIBIT 7.5 Selected Financial Data for Comparable Companies (in millions of USD, except percentages, ratios, and per share data; financial statement data as of fiscal year 2013) Market Cap of Equity Bond Credit Rating Company Sales EBITDA Total Debt Beta 1,222 0 Natural & Organic Whole Foods Market Sprouts Farmers Market The Fresh Market 12,917 2,438 1,512 187 14.481 4,102 1,554 0.70 0.75 0.80 NA BB- NA 138 Conventional Grocers Kroger Safeway Supervalu 98,375 36,139 17,155 35,139 1.5797,399 4,428 1,579 720 23,679 7,899 1,876 11,311 4,451 2,531 4,451 0.75 0.70 0.75 1.00 BBB BBB B- Supercenters and Wholesalers Wal-Mart Target Costco 476,294 72,596 105,156 35,742 6,452 3,999 251,747 36,806 49.257 55,245 14,089 4,985 0.60 0.75 0.75 EXHIBIT 7.7 Deutsche Bank Model (in millions of USD, except per share figures) At Fiscal Year End Actual 2011 Actual 2012 Actual 2013 Forecast 2014 forecast 2015 Store Growth Sales Growth EBITDA Margin Tax Rate 4.0% 12.2% 8.5% 38.1% 7.0 7.7% 15.7% 9.0% 38.4% 8.1% 10.4% 9.5% 38.8% 10.5% 11.1% 9.4% 39.0% 12.6% 14.0% 9.8% 39.0% 7.0 7.1 6.5 10.7 mover 10.5 10.5 5.6 10.9 6.5 0.93 10.5 6.7 6.7 6.4 1.00 6.7 0.94 0.94 0.94 Current Asset Turnover Current Liabilities Turnover Net PP&E/Store Annual Dep. & Amort./Store Stores Sales EBITDA Dep. & Amort. 311 362 12,917 1.222 339 400 14,351 1,352 450 16,360 1,600 423 1.176 459 376 976 EBIT 883 343 381 596 717 Taxes Net Income Shares Outstanding Earnings per Share 10,108 859 311 548 209 339 350 0.97 1,453 880 573 1,997 13.2% 335 11,699 1.055 311 744 286 458 364 1.26 2,103 977 1,126 2,193 13.8% 372 372 1.93 1.60 Current Assets Current Liabilities Net Working Capital Net PP&E 540 372 1.45 1.980 1,088 892 2,428 16.3% 2.050 1,238 812 2,680 2,304 1,406 898 3.018 18.3% Return on Capital 17.1% Data source: Company financial reports, Deutsche Bank research, and author estimates