Using Porter's Diamond model (1. factor conditions 2. related and supporting industries 3. firm strategy, structure, and rivalry 4. demand conditions) analyze the case: Resuming Internationalization at Starbucks(see attached case)
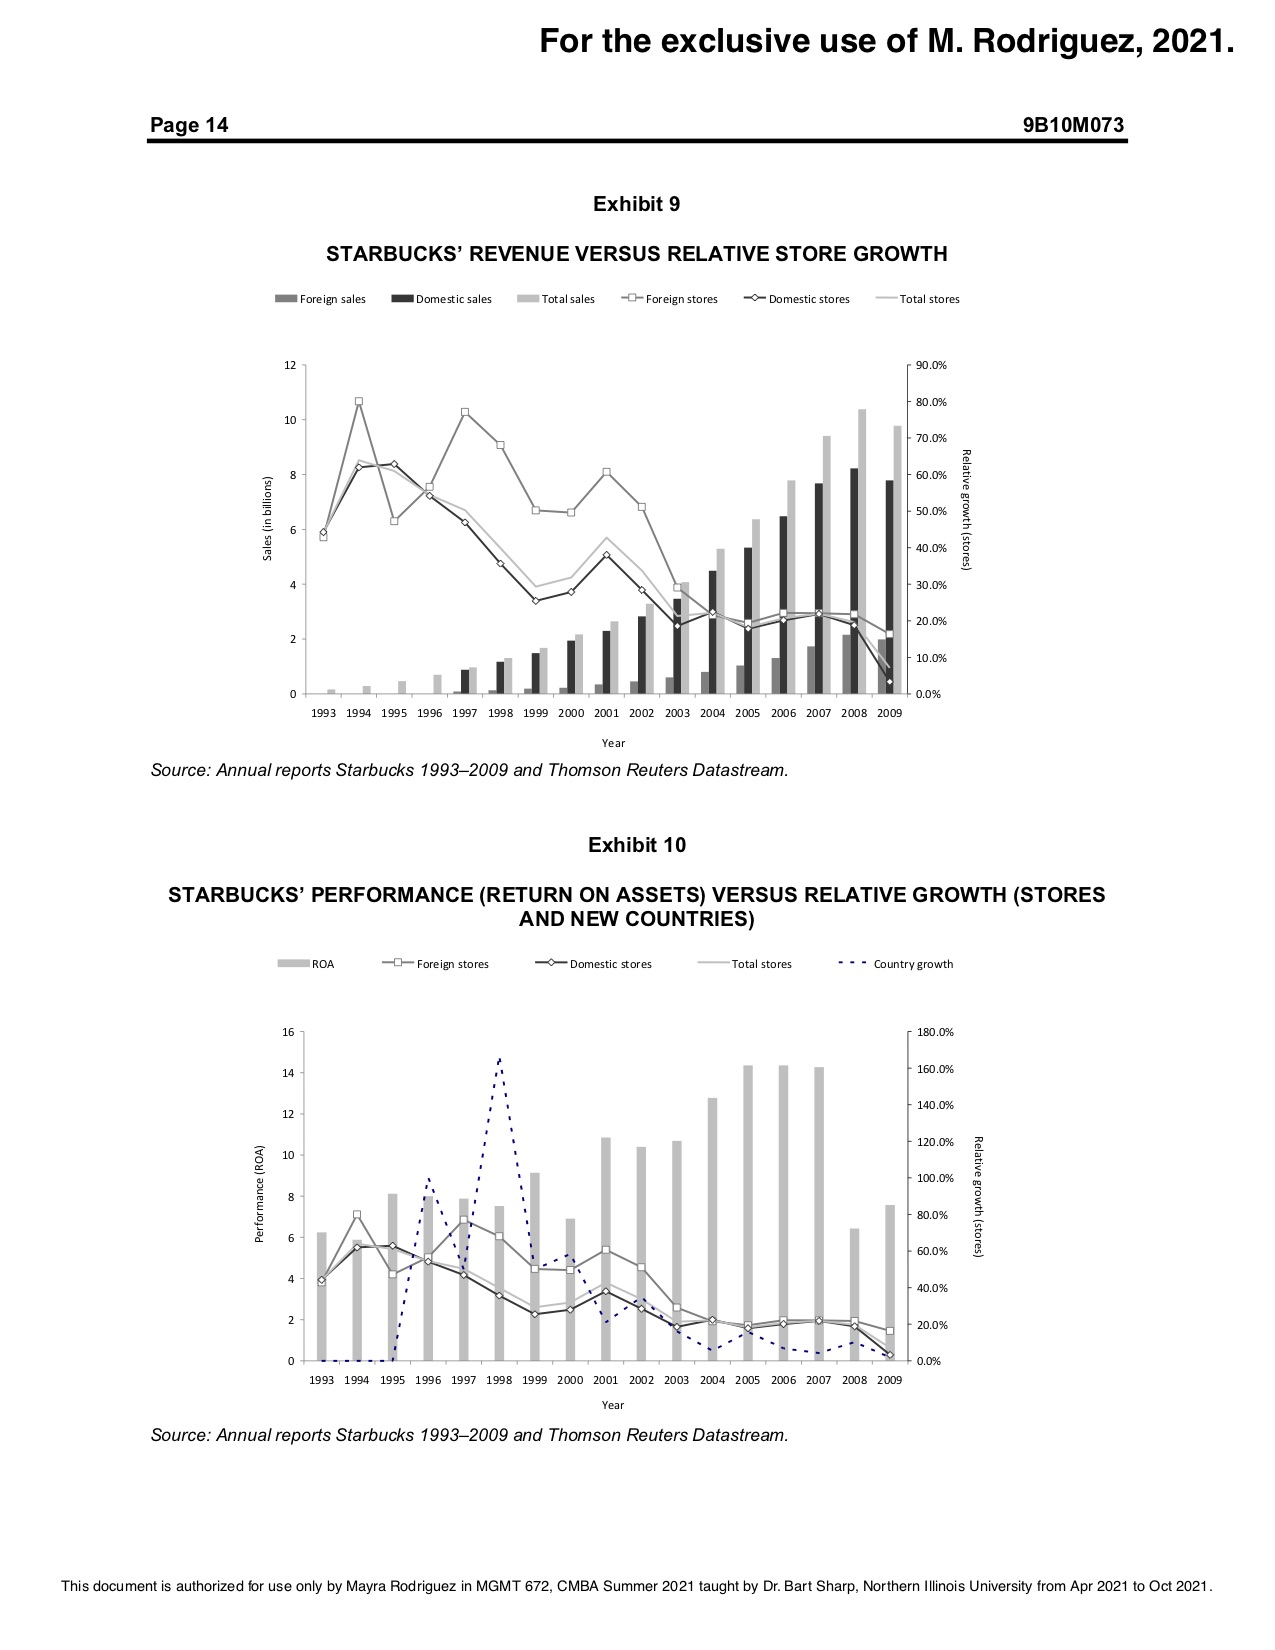
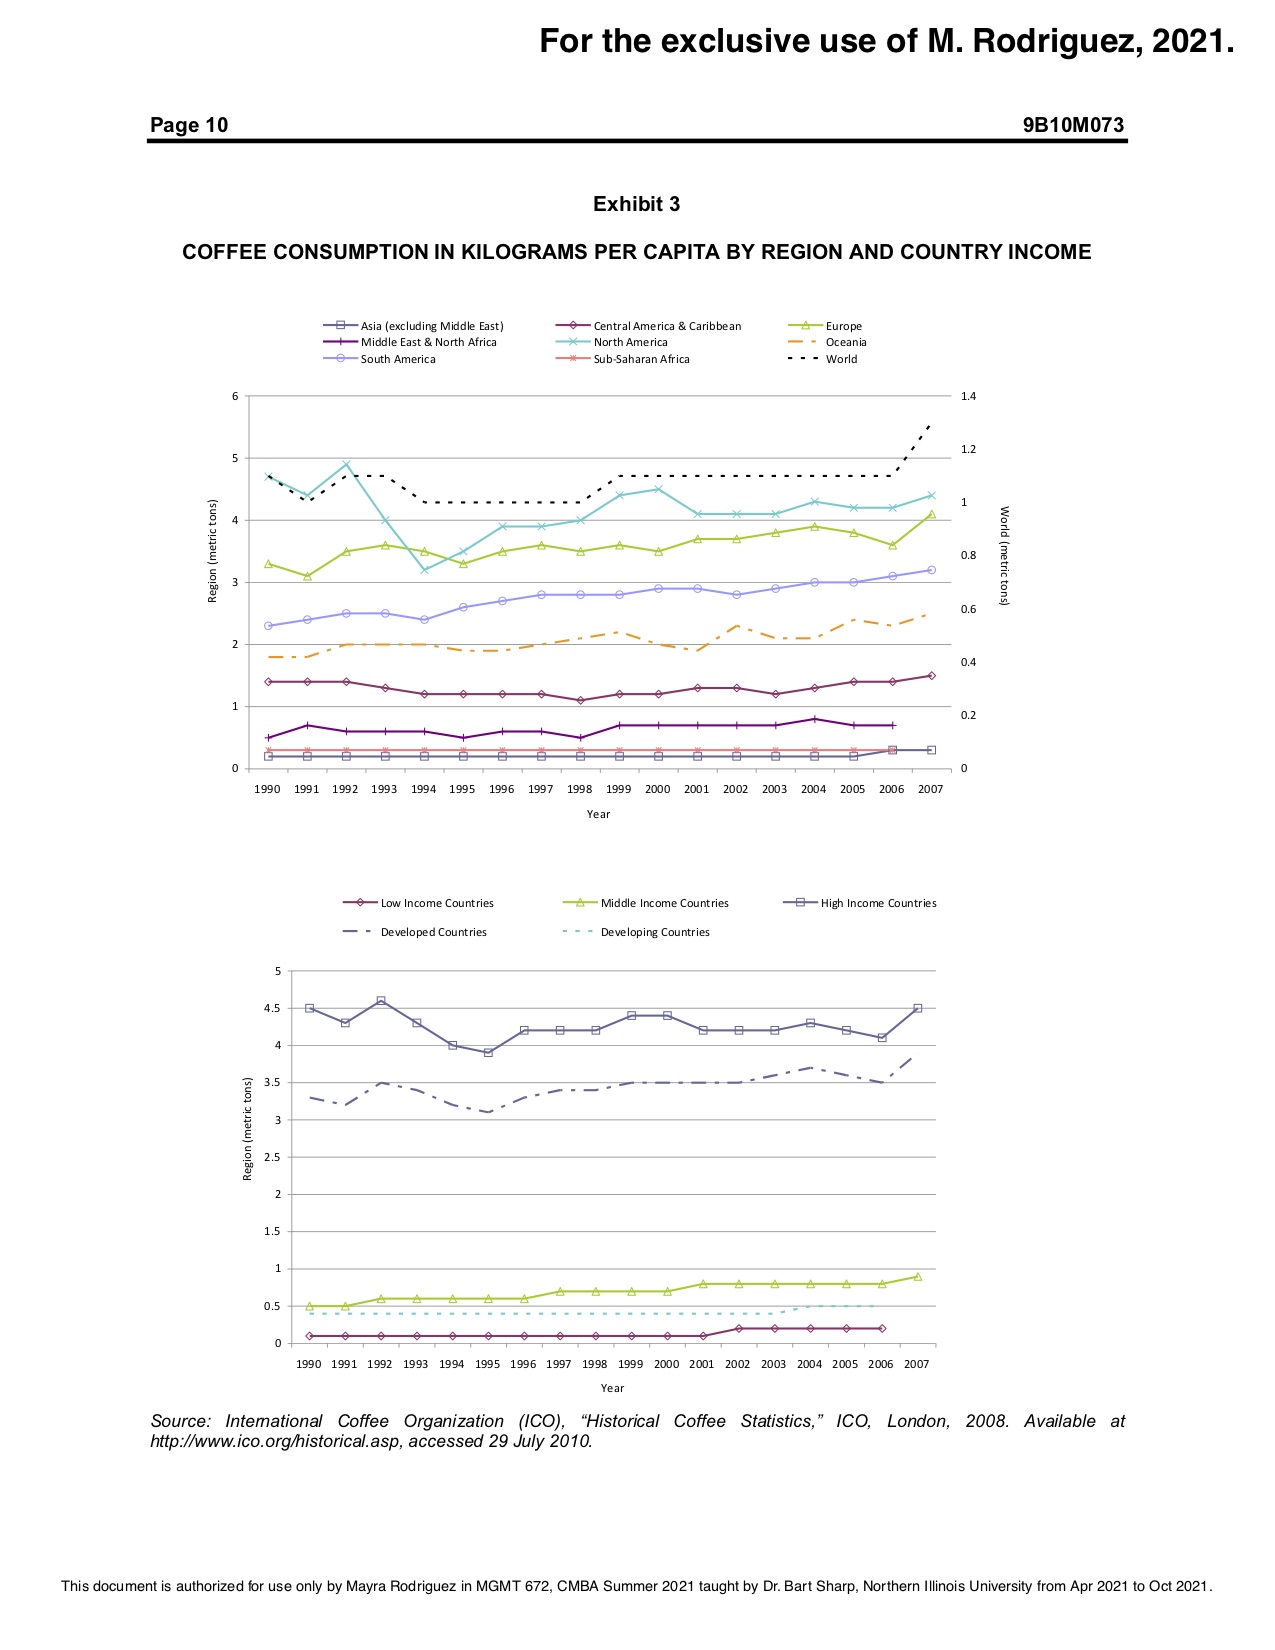
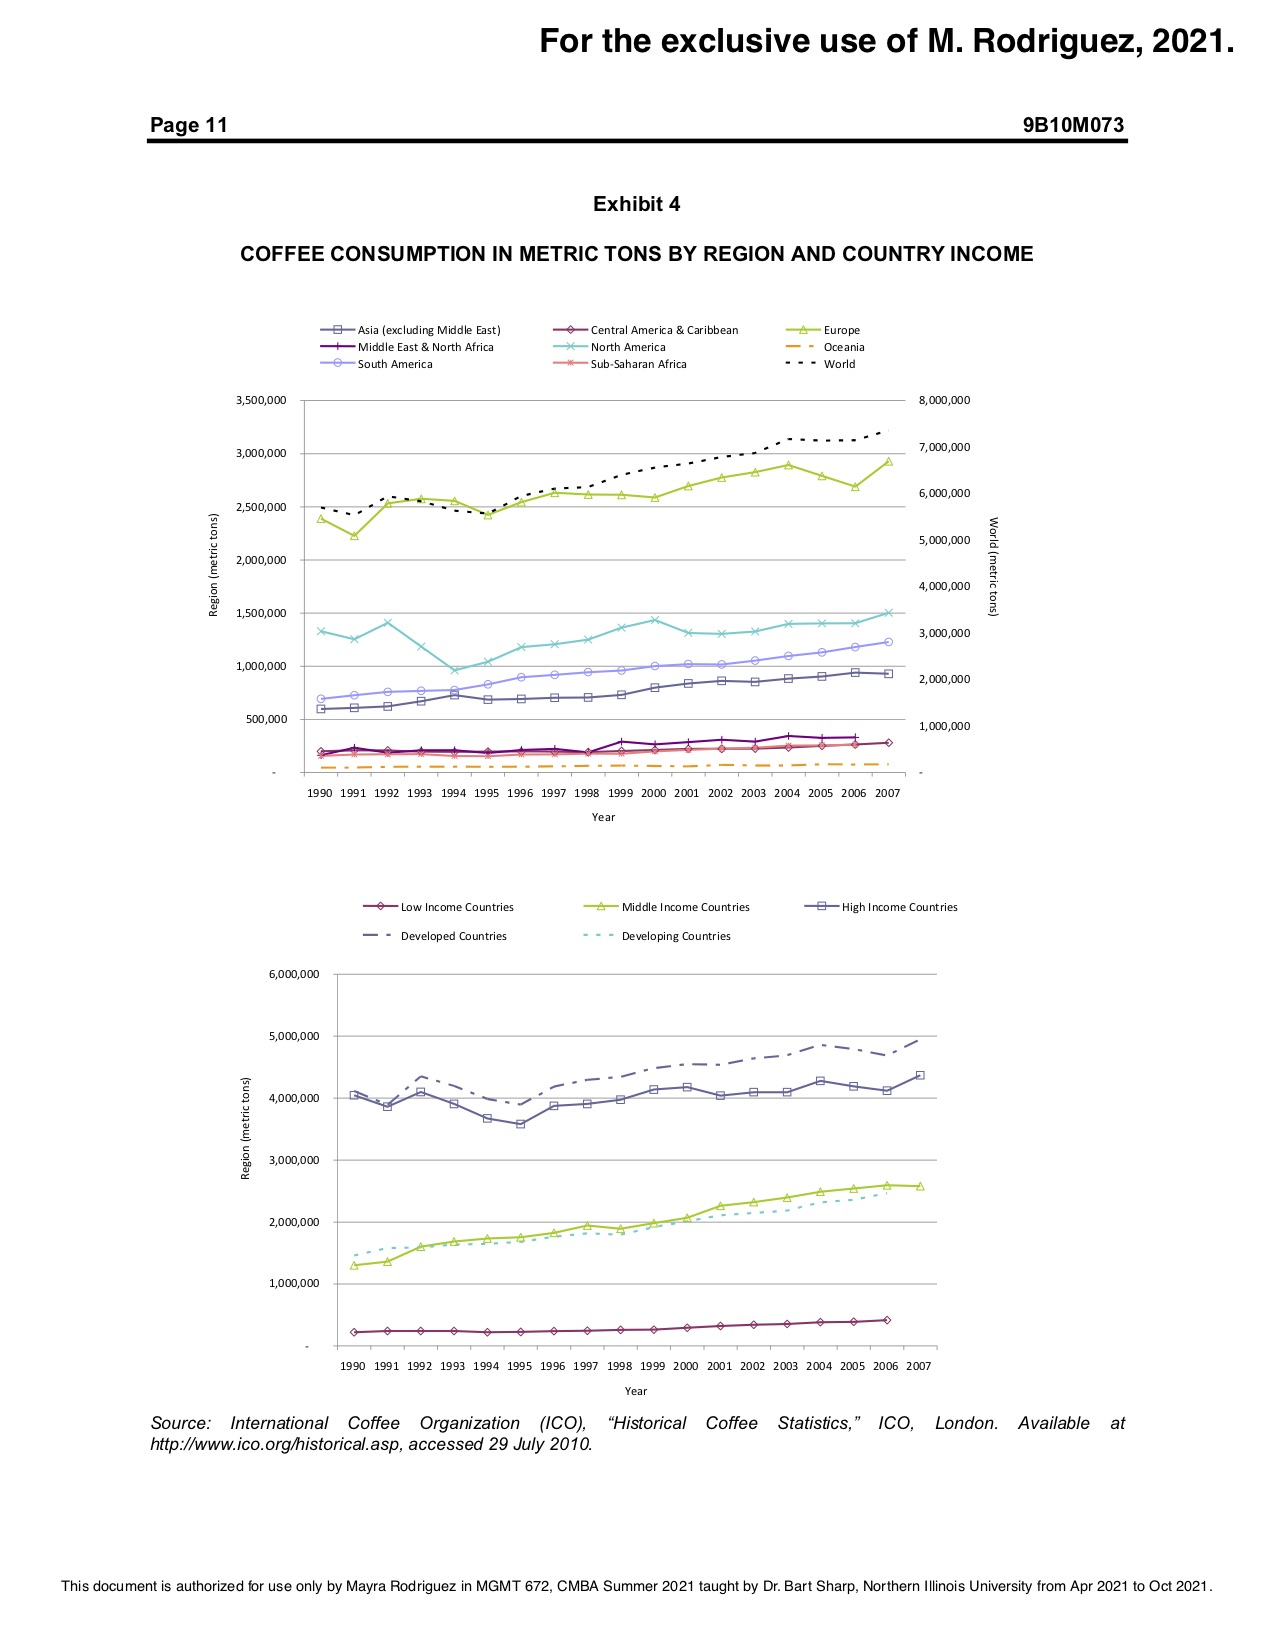
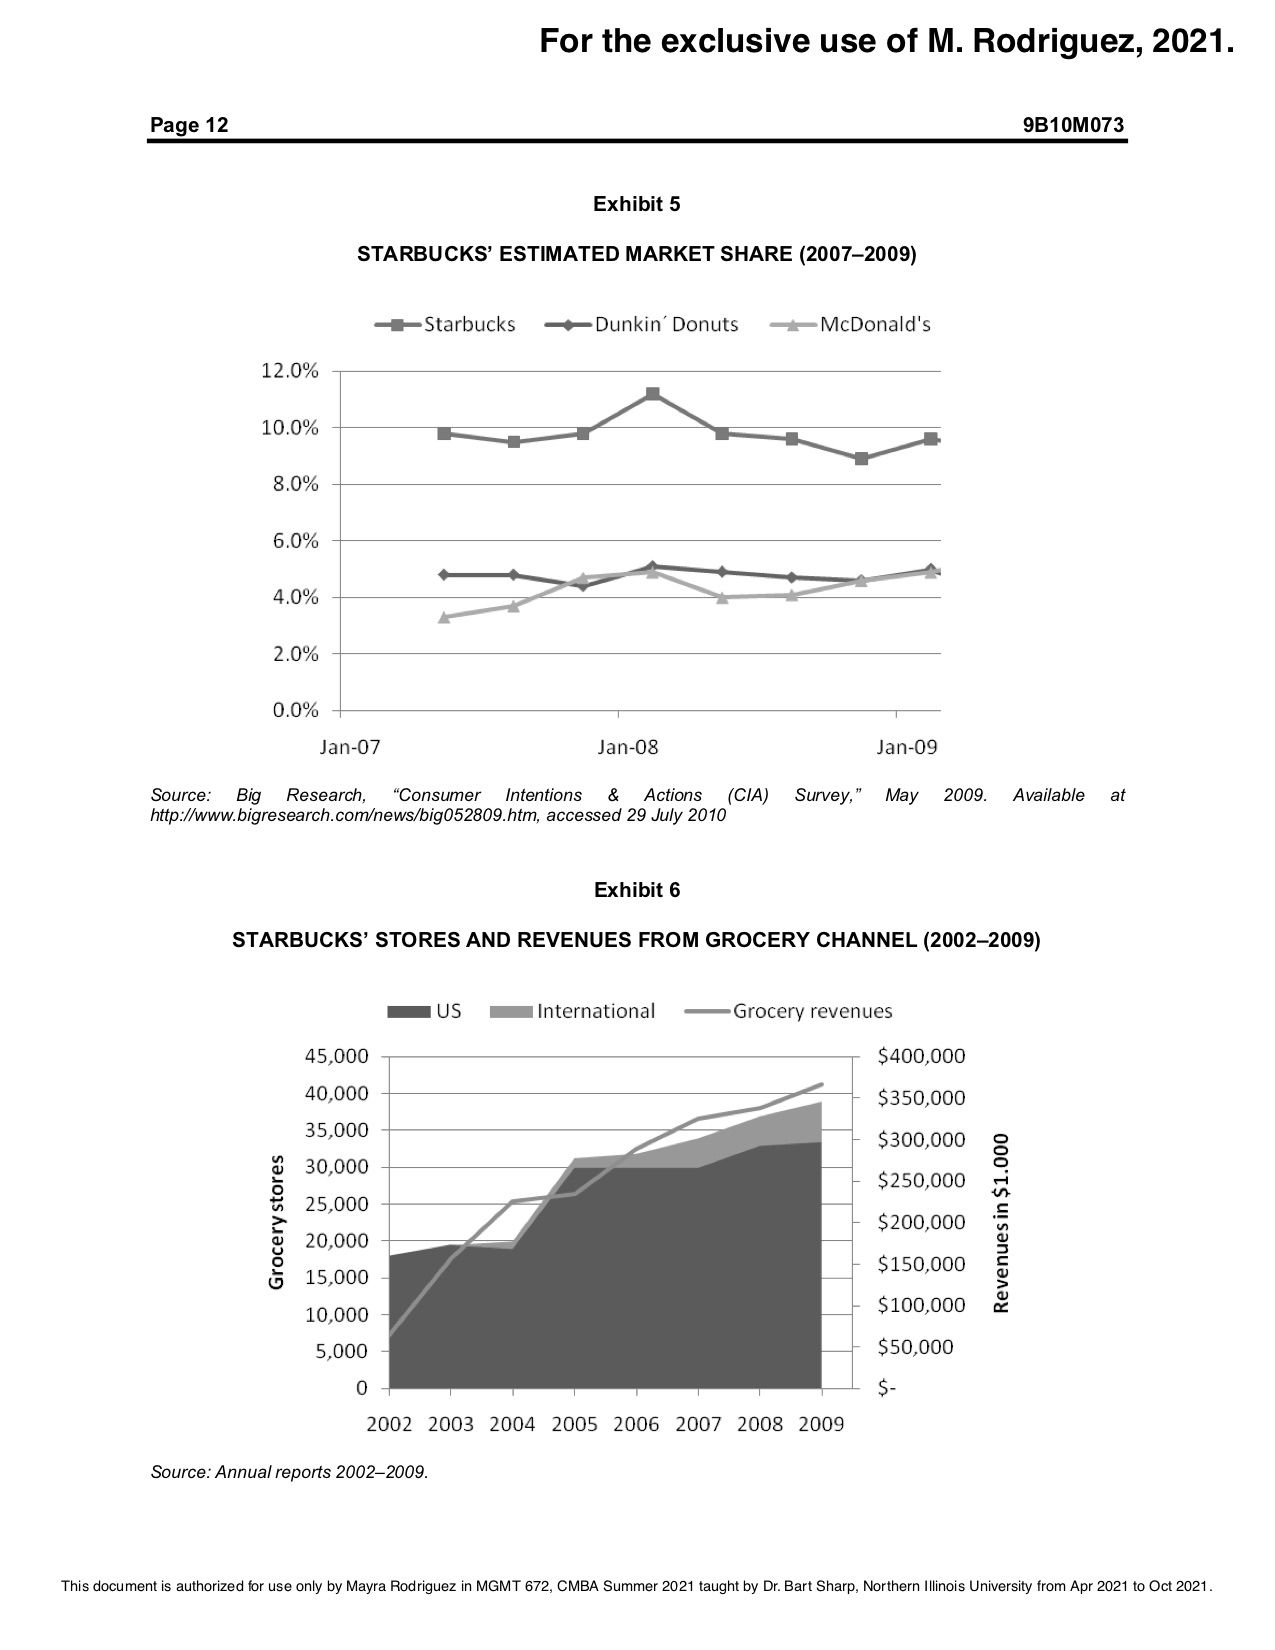
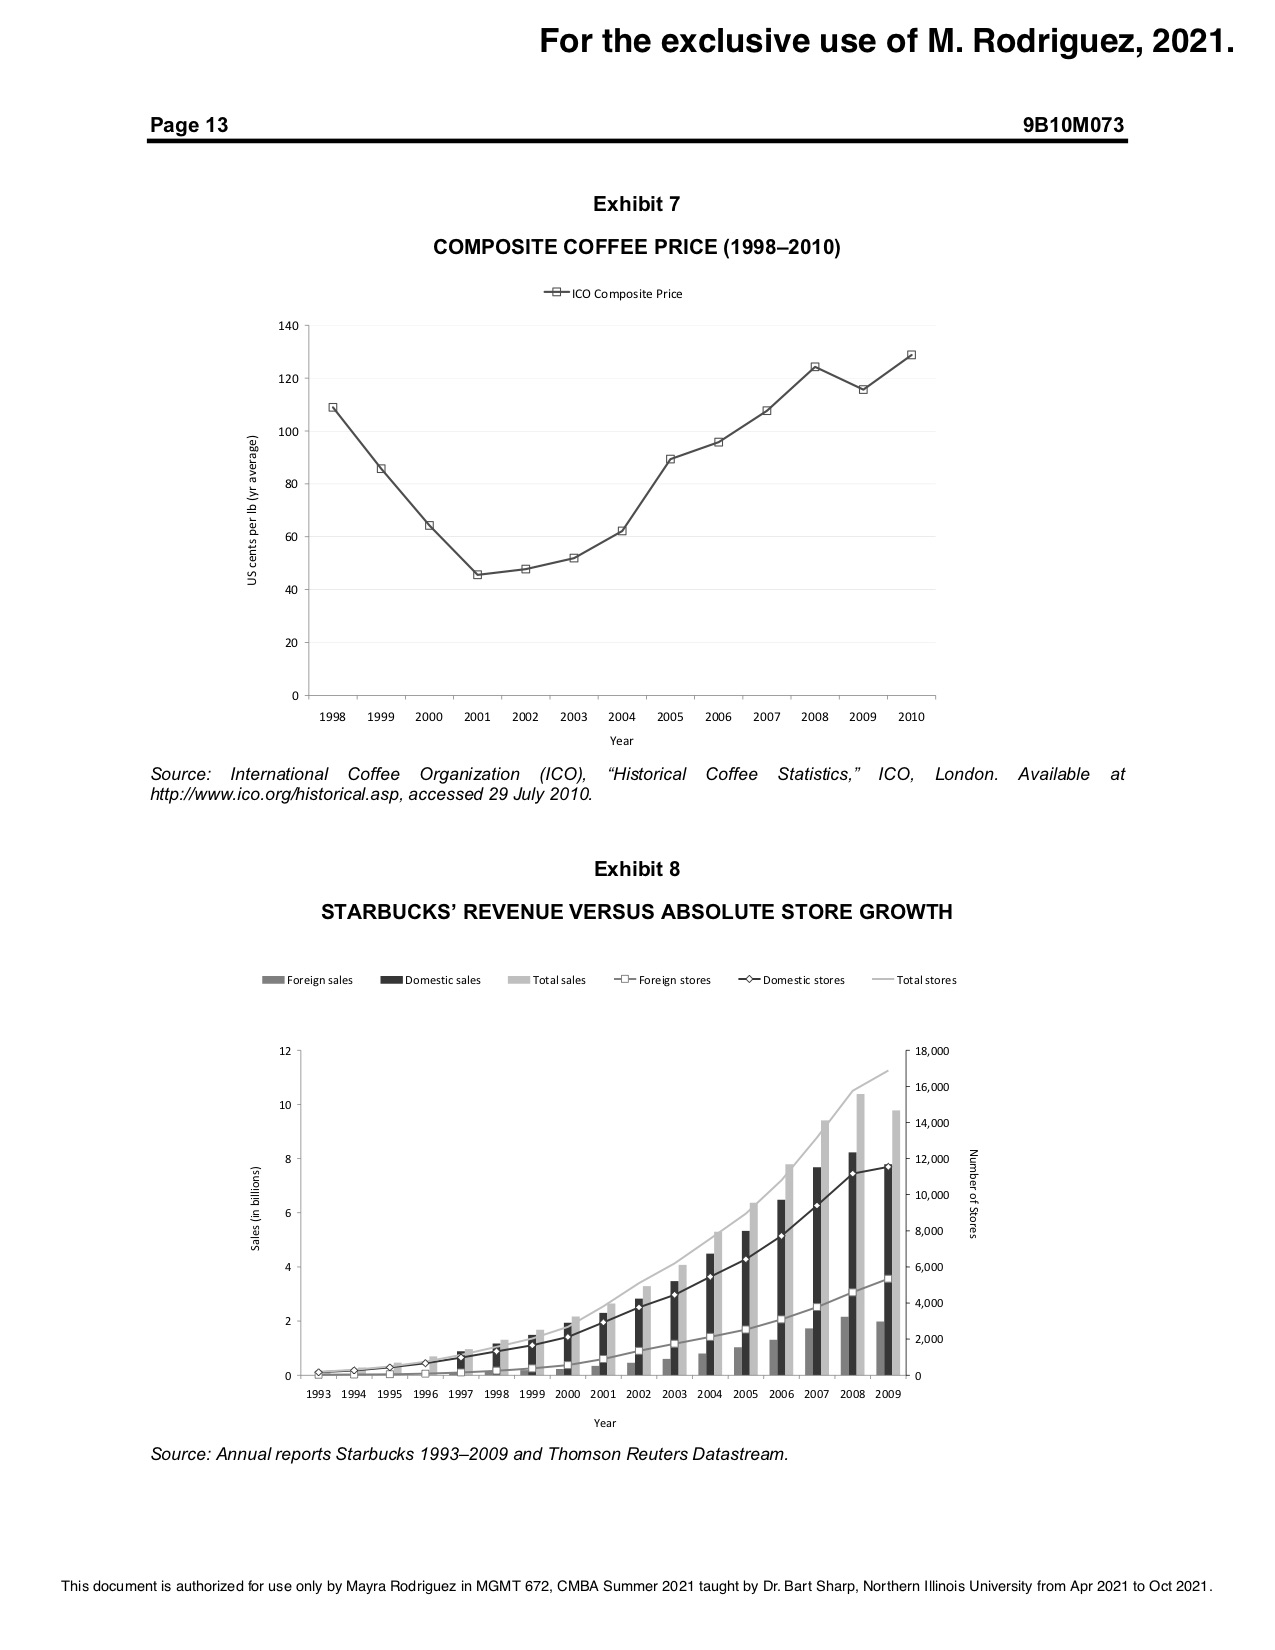
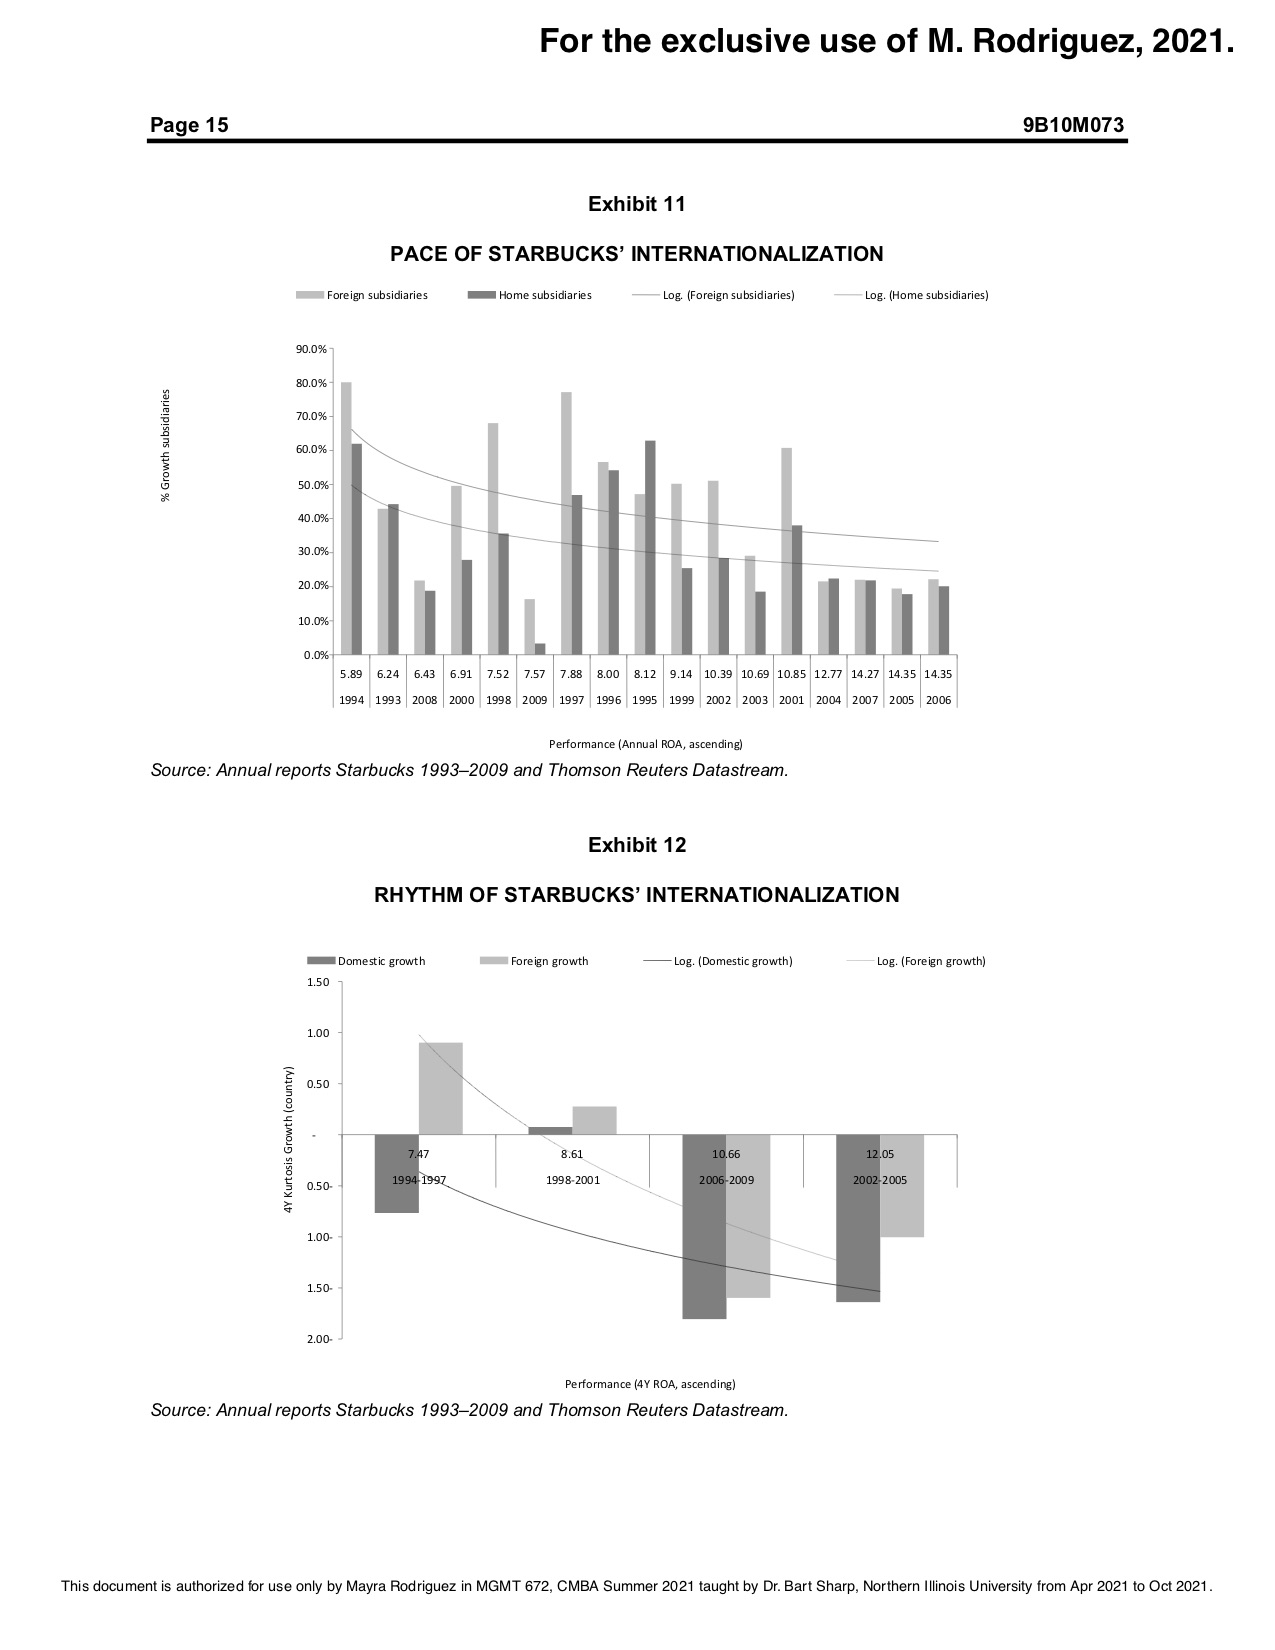
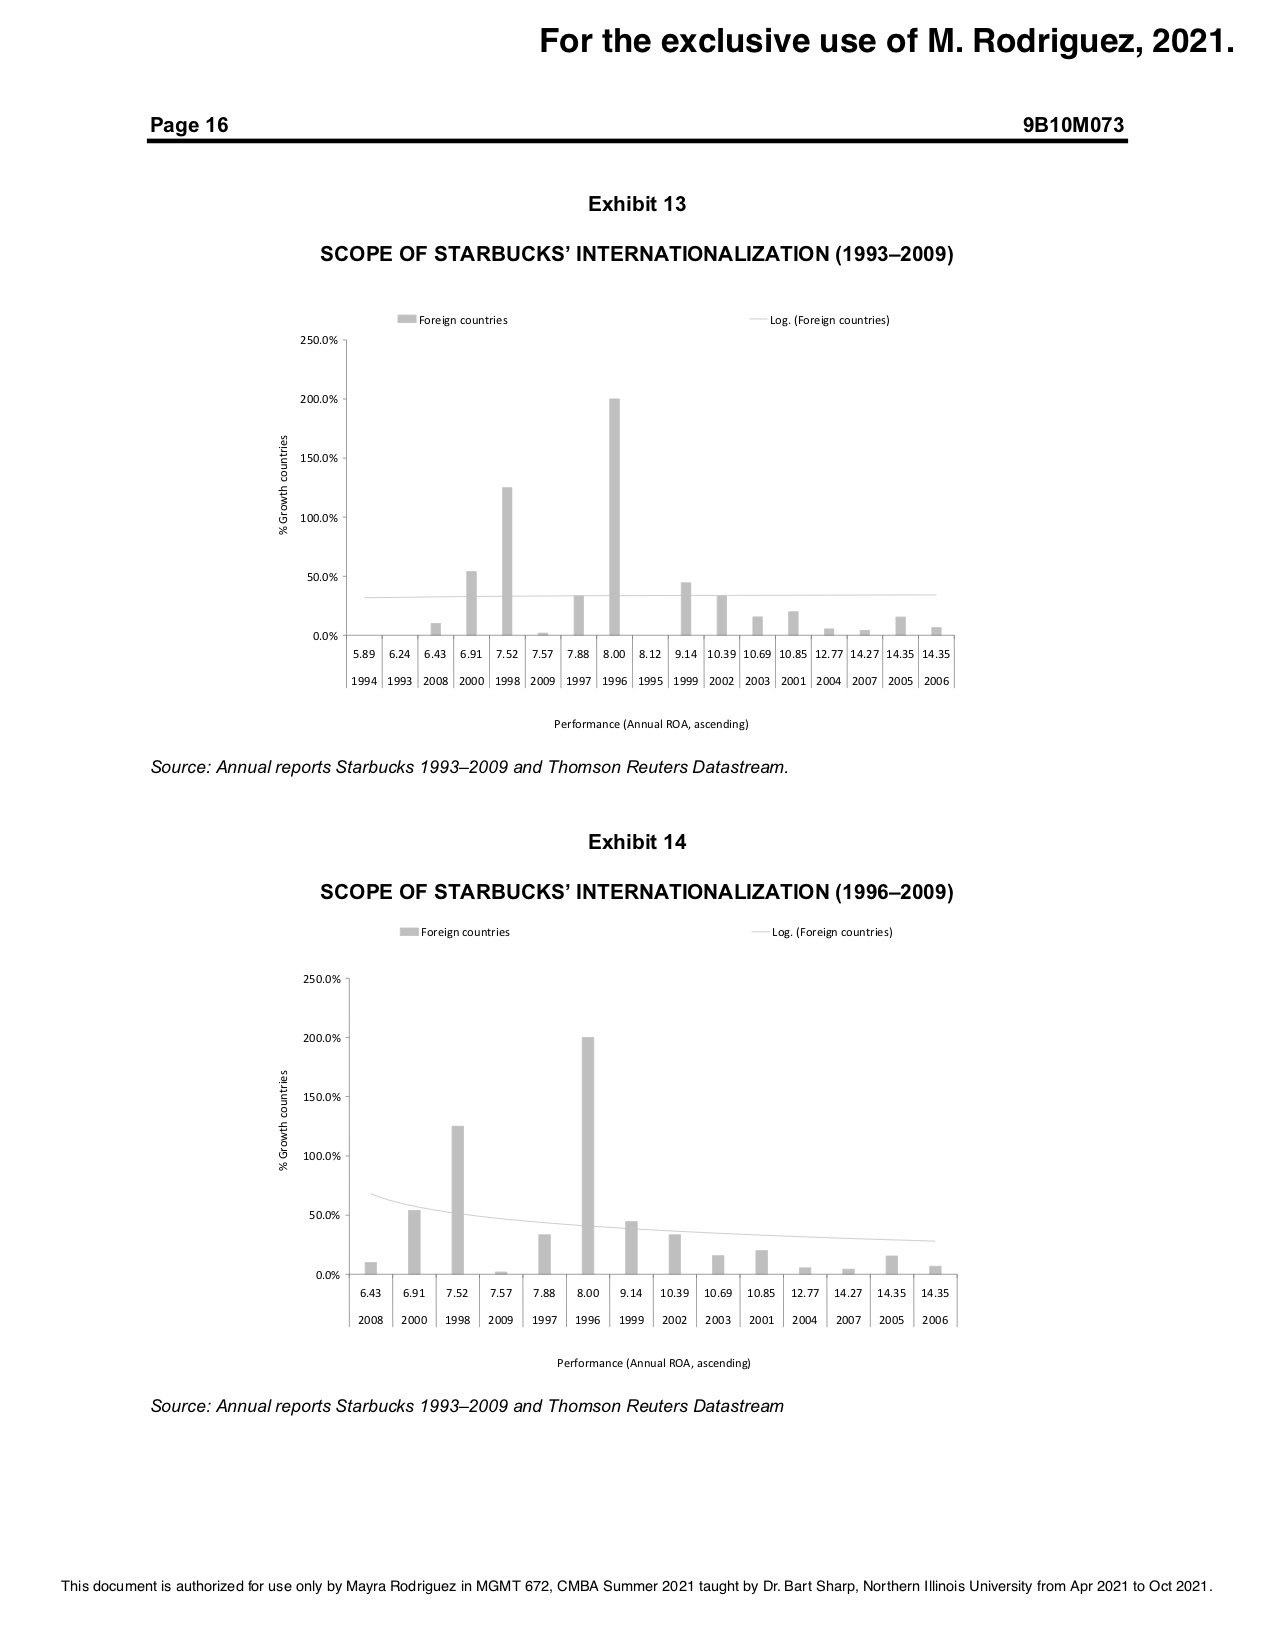
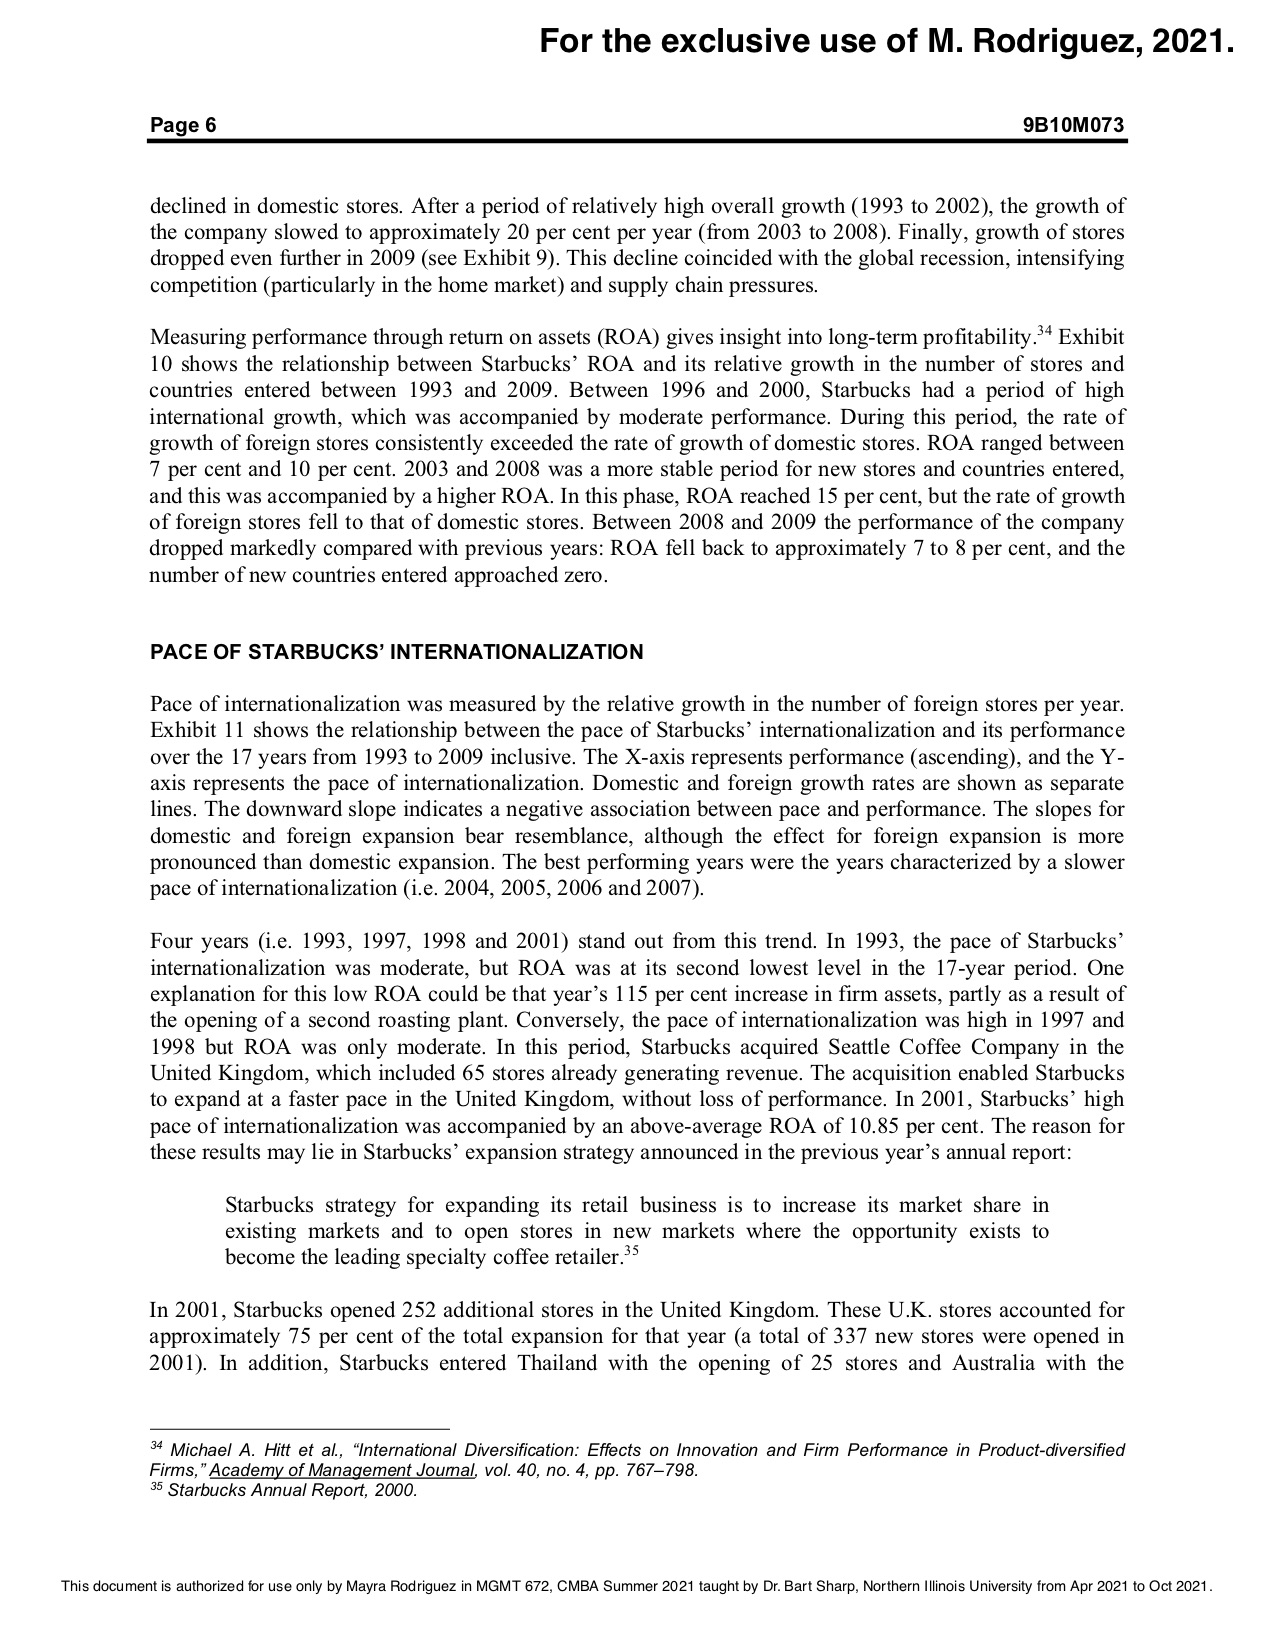
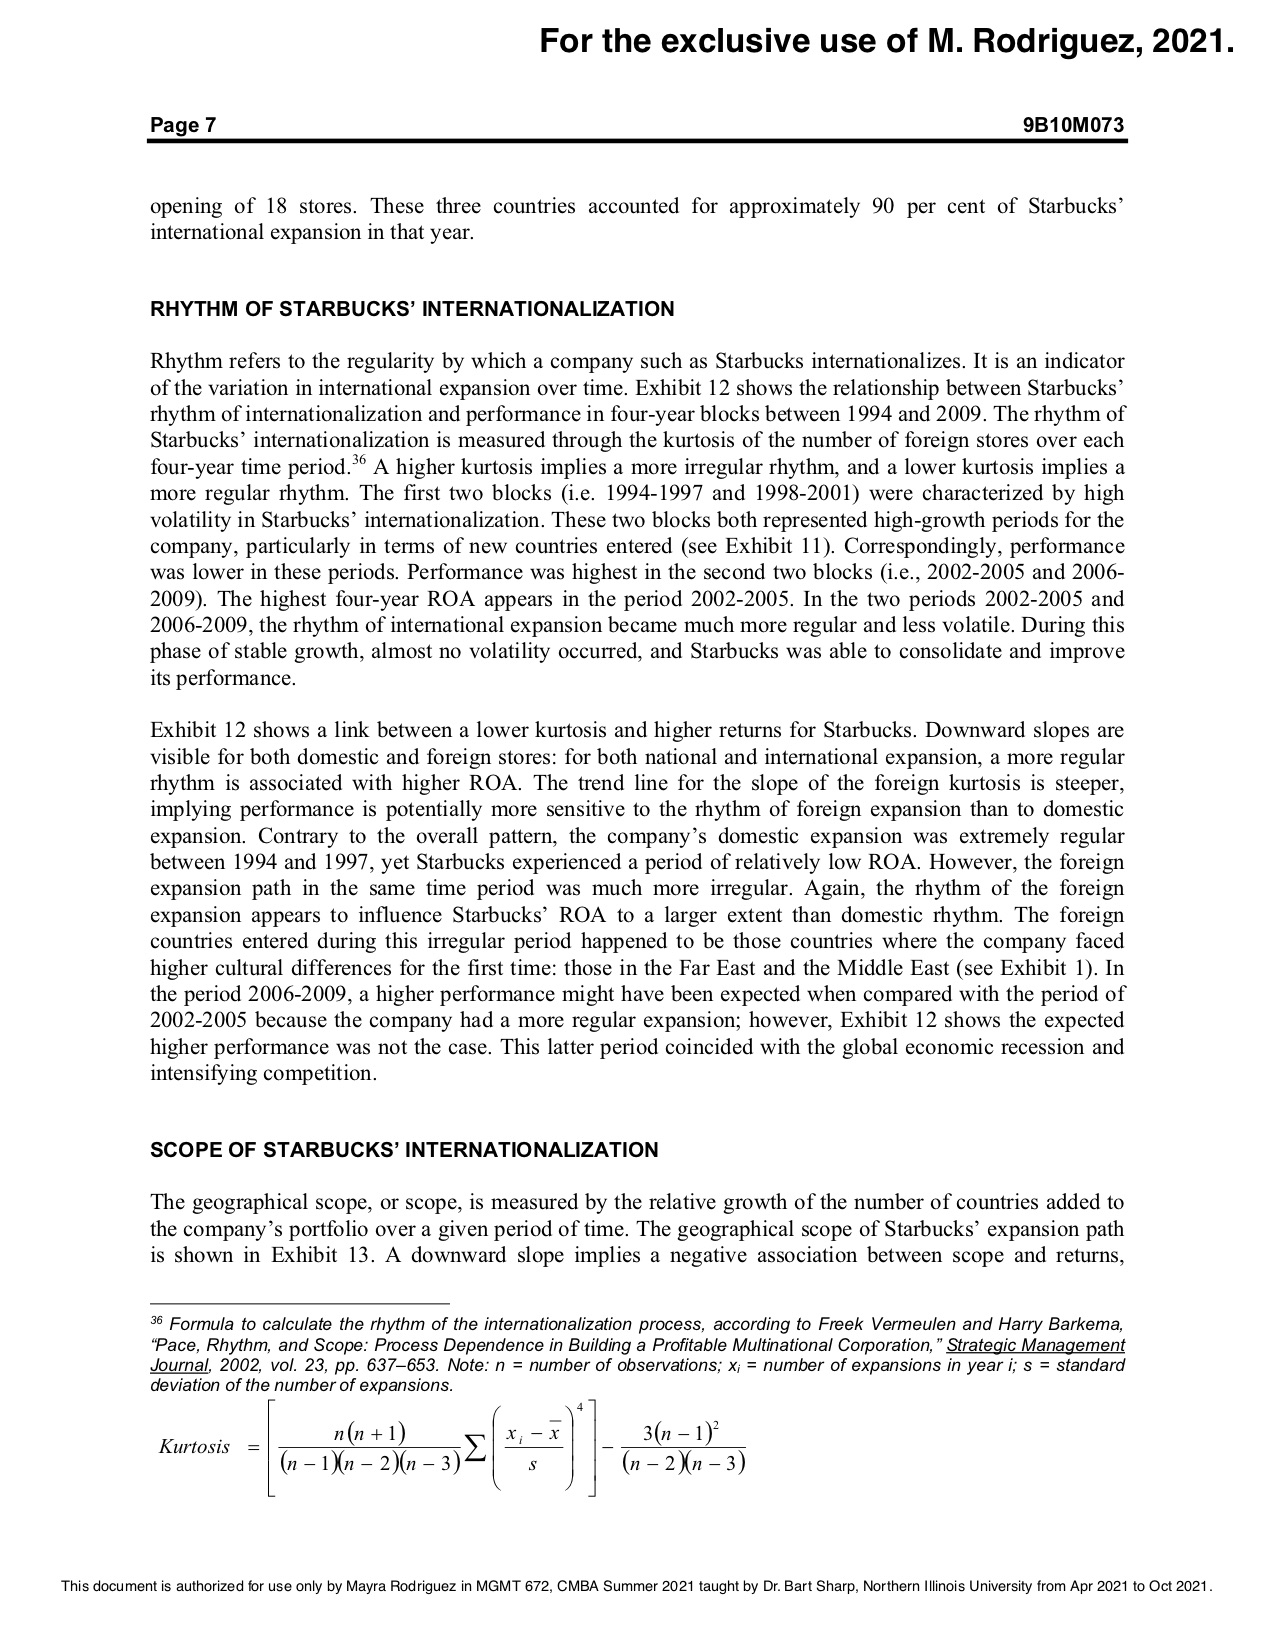
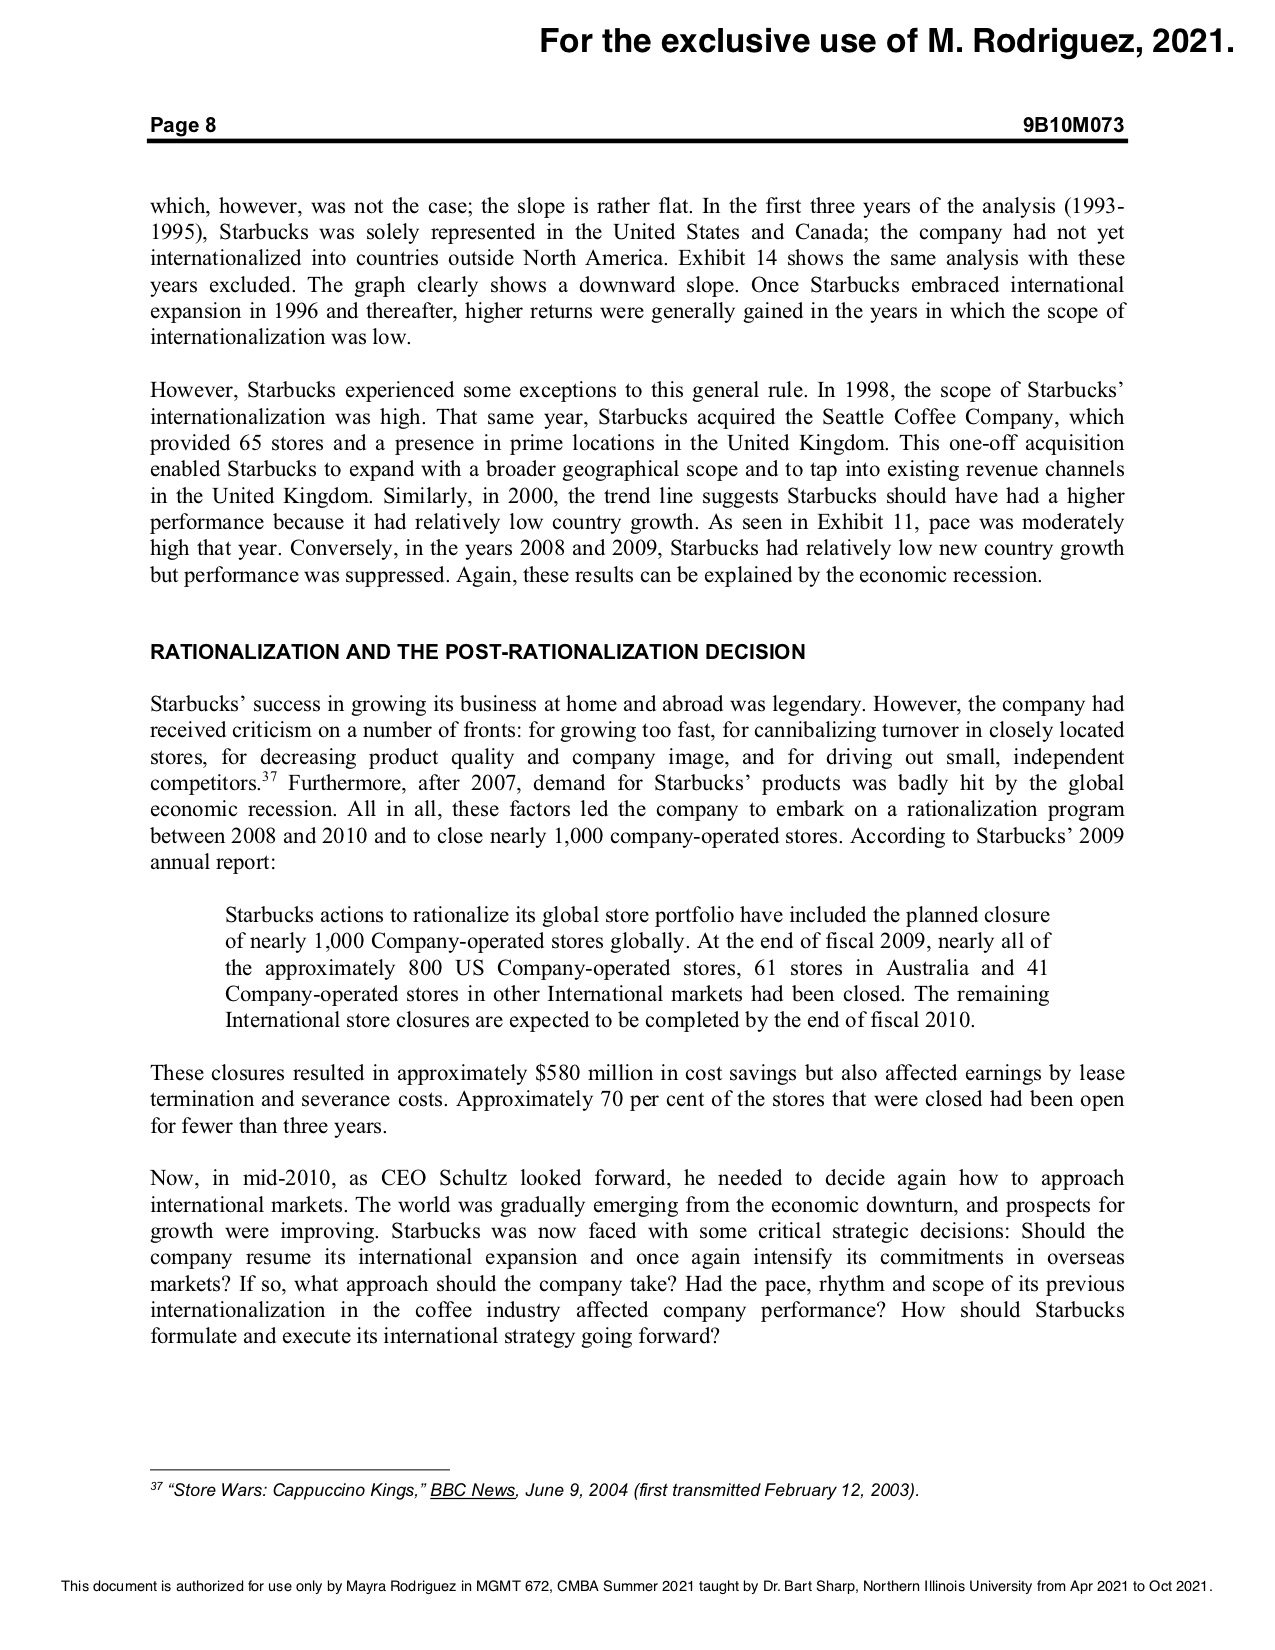
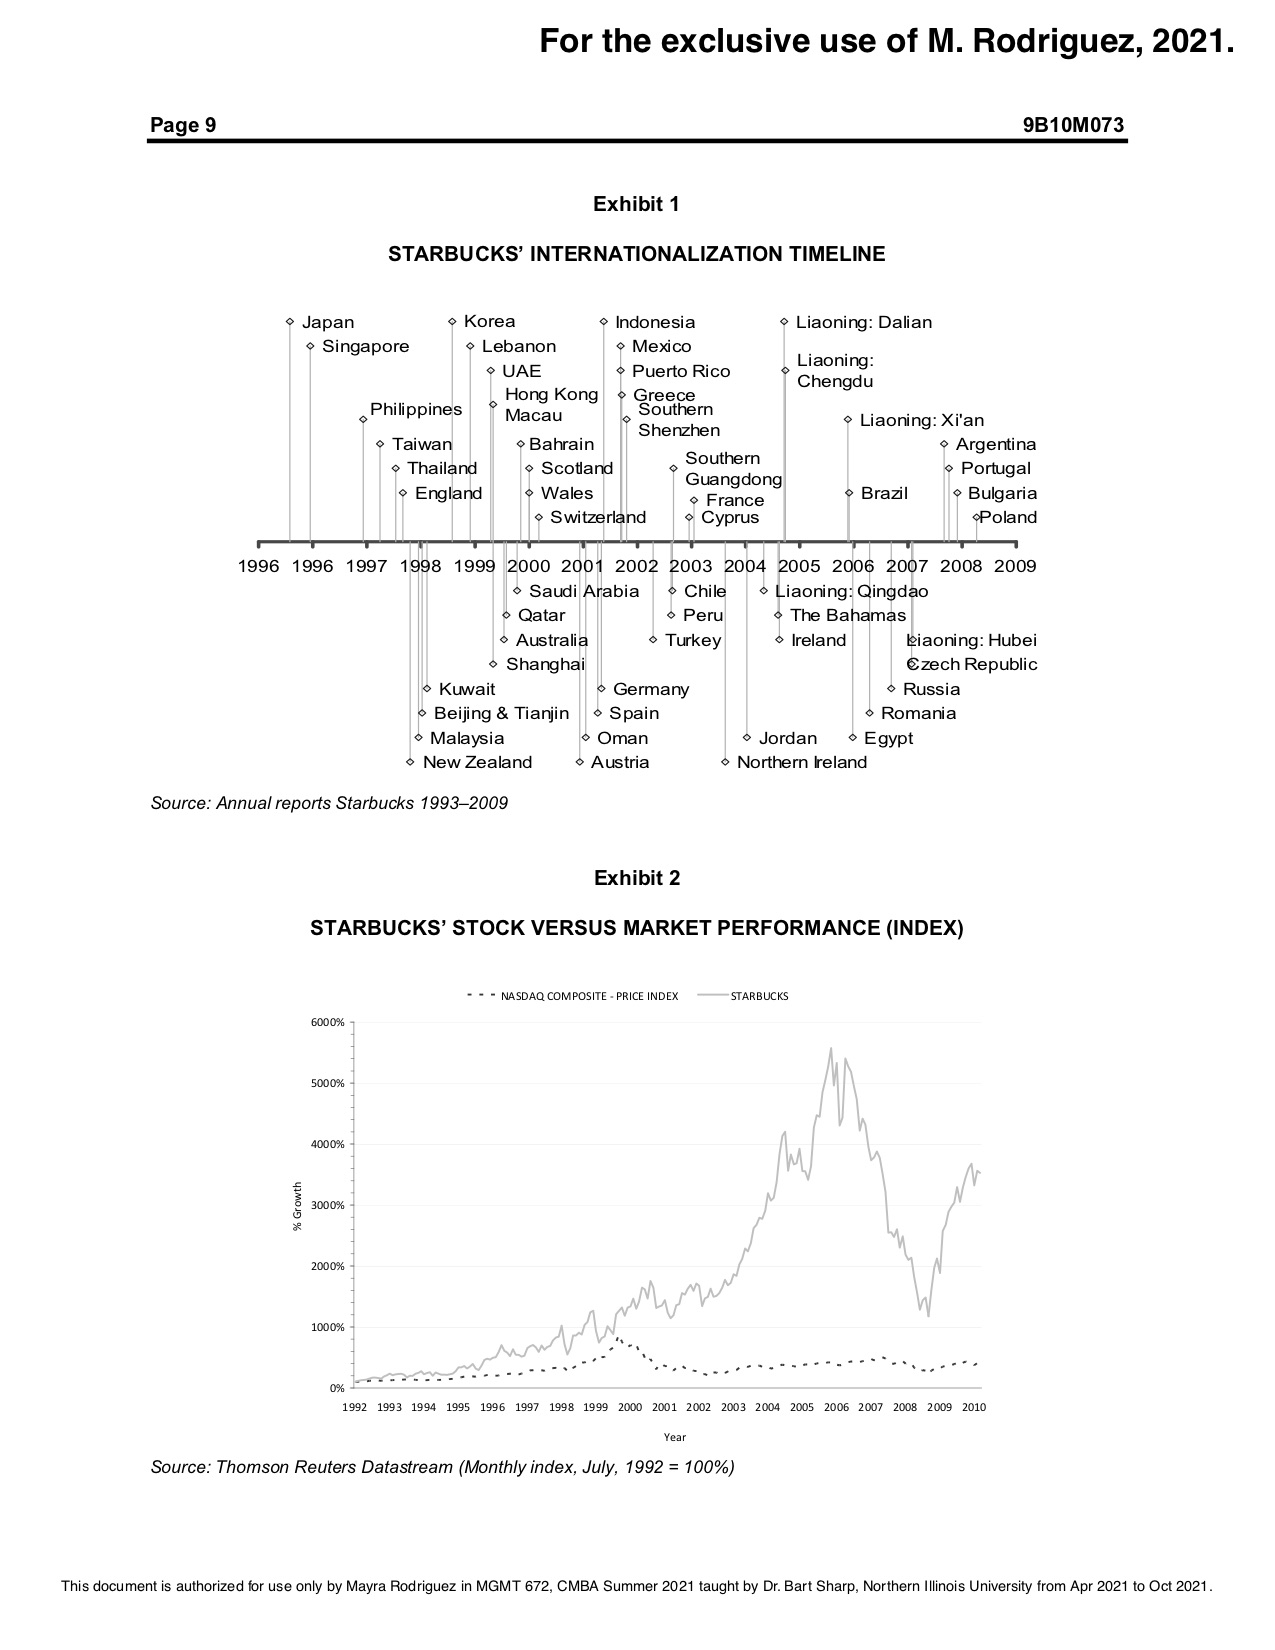
For the exclusive use of M. Rodriguez, 2021. Page 14 9B10M073 Exhibit 9 STARBUCKS' REVENUE VERSUS RELATIVE STORE GROWTH Foreign sales Domestic sales Total sales - Foreign stores Domestic stores Total stores 12 7 90.0% - 80.0% 10 70.0% 8 60.0% 50.0% Relative growth (stores) Sales (in billions) 40.0% 30.0% 20.0% N 10.0% 0.0% 1993 1994 1995 1996 1997 1998 1999 2000 2001 2002 2003 2004 2005 2006 2007 2008 2009 Year Source: Annual reports Starbucks 1993-2009 and Thomson Reuters Datastream. Exhibit 10 STARBUCKS' PERFORMANCE (RETURN ON ASSETS) VERSUS RELATIVE GROWTH (STORES AND NEW COUNTRIES) ROA Foreign stores Domestic stores Total stores - - - Country growth 16 180.0% 14 160.0% 140.0% 12 120.0% 10 100.0% Performance (ROA) Relative growth (stores) 80.0% - 60.0% - . . 40.0% N 20.0% 1 0.0% 1993 1994 1995 1996 1997 1998 1999 2000 2001 2002 2003 2004 2005 2006 2007 2008 2009 Year Source: Annual reports Starbucks 1993-2009 and Thomson Reuters Datastream. This document is authorized for use only by Mayra Rodriguez in MGMT 672, CMBA Summer 2021 taught by Dr. Bart Sharp, Northern Illinois University from Apr 2021 to Oct 2021.For the exclusive use of M. Rodriguez, 2021. IVEy Publishing 910M73 RESUMING INTERNATIONALIZATION AT STARBUCKS Rob Alkema, Mario Koster and Christopher Williams wrote this case solely to provide material for class discussion. The authors do not intend to illustrate either effective or ineffective handling of a managerial situation. The authors may have disguised certain names and other identifying information to protect confidentiality. Richard Ivey School of Business Foundation prohibits any form of reproduction, storage or transmission without its written permission. Reproduction of this material is not covered under authorization by any reproduction rights organization. To order copies or request permission to reproduce materials, contact Ivey Publishing, Richard Ivey School of Business Foundation, The University of Western Ontario, London, Ontario, Canada, N6A 3K7; phone (519) 661-3208; fax (519) 661-3882; e-mail cases@ivey.uwo.ca Copyright @ 2010, Richard Ivey School of Business Foundation Version: 2017-05-04 By 2009, Starbucks had achieved a global reach of almost 17,000 stores in 56 countries. The company had enjoyed tremendous growth over the previous two decades. Between 2007 and 2009, however, Starbucks' relentless march had been slowed by three forces: increasingly intense competition, rising coffee bean prices and a global economic recession. To remain profitable, the company started to scale back its overseas operations. In 2010, as the world gradually emerged from the economic downturn and as prospects for growth improved, Starbucks was faced with a critical strategic decision: Should the company resume its international expansion and once again intensify its commitments in overseas markets? If so, what approach should the company take? Had the pace of Starbucks' internationalization (i.e. the rate of opening new stores abroad), the rhythm of its internationalization (i.e. the regularity by which stores were opened abroad) and the geographical scope of its internationalization (i.e. the number of new countries entered) affected the company's performance in previous years?" What could Starbucks learn from its prior internationalization within the coffee industry to guide its future international strategy? BACKGROUND In 1971, the first Starbucks store was opened in Seattle to sell coffee beans and coffee-making equipment. The current chief executive officer (CEO), Howard Schultz, joined the company in 1982. After a vacation in Italy, he became enthusiastic about bringing the Italian coffee-drinking culture to the United States. He was especially excited about opportunities for selling coffee and espresso products - Italian style - but was not able to convince Starbucks' owners at the time. Schultz ended up opening his own coffee bar, II Giornale. In 1987, Schulz bought the Starbucks store, renamed the II Giornale stores to Starbucks and started to open new stores in the United States and Canada. In 1992, the company went public. In 1996, with the home market becoming increasingly saturated, Starbucks opened its first outlets outside North America, in the Far East. Ever since, the company has pursued a relentless international expansion. By 2009, Starbucks had grown to nearly 17,000 stores in 56 countries worldwide (see Exhibit 1). Starbucks' stock had performed well over this period (see Exhibit 2). Schultz's initial reading of the global market for coffee appeared to have been correct: up to 2007 at least, global markets for specialty coffee continued to grow in size, particularly in high- and middle-income countries (see Exhibit 3 and Exhibit 4). 1 This case has been written on the basis of published sources only. Consequently, the interpretation and perspectives presented in this case are not necessarily those of Starbucks or any of its employees. 2 Freek Vermeulen and Harry Barkema, "Pace, Rhythm, and Scope: Process Dependence in Building a Profitable Multinational Corporation, "Strategic Management Joumal, 2002, vol. 23, pp. 637-653. This document is authorized for use only by Mayra Rodriguez in MGMT 672, CMBA Summer 2021 taught by Dr. Bart Sharp, Northern Illinois University from Apr 2021 to Oct 2021.For the exclusive use of M. Rodriguez, 2021. Page 10 9B10M073 Exhibit 3 COFFEE CONSUMPTION IN KILOGRAMS PER CAPITA BY REGION AND COUNTRY INCOME Asia (excluding Middle East) - Central America & Caribbean A Europe - Middle East & North Africa *North America - - Oceani - South America - Sub-Saharan Africa - - - World 1.4 1.2 0.8 World (metric tons) Region (metric tons) w 0.6 N 0.4 0.2 0 - 7 0 1990 1991 1992 1993 1994 1995 1996 1997 1998 1999 2000 2001 2002 2003 2004 2005 2006 2007 Year Low Income Countries A Middle Income Countries -8High Income Countries - - Developed Countries - - - Developing Countries 15 4 3.5 w Region (metric tons) 2.5 N 1.5 0.5 1990 1991 1992 1993 1994 1995 1996 1997 1998 1999 2000 2001 2002 2003 2004 2005 2006 2007 Year Source: Intemational Coffee Organization (ICO), "Historical Coffee Statistics," ICO, London, 2008. Available at http://www.ico. org/historical.asp, accessed 29 July 2010. This document is authorized for use only by Mayra Rodriguez in MGMT 672, CMBA Summer 2021 taught by Dr. Bart Sharp, Northern Illinois University from Apr 2021 to Oct 2021.For the exclusive use of M. Rodriguez, 2021. Page 11 9B10M073 Exhibit 4 COFFEE CONSUMPTION IN METRIC TONS BY REGION AND COUNTRY INCOME Asia (excluding Middle East) Central America & Caribbean Europe Middle East & North Africa North America - Oceania South America Sub-Saharan Africa - - - World 3,500,000 8,000,000 3,000,000 7,000,000 6,000,000 2,500,000 5,000,000 2,000,000 Region (metric tons World (metric tons) 4,000,000 1,500,000 3,000,000 1,000,000 2,000,000 500,000 1,000,000 1990 1991 1992 1993 1994 1995 1996 1997 1998 1999 2000 2001 2002 2003 2004 2005 2006 2007 Year Low Income Countries Middle Income Countries High Income Countries - Developed Countries - - - Developing Countries 6,000,000 5,000,000 4,000,000 Region (metric tons 3,000,000 2,000,000 1,000,000 1990 1991 1992 1993 1994 1995 1996 1997 1998 1999 2000 2001 2002 2003 2004 2005 2006 2007 Year Source: International Coffee Organization (ICO), "Historical Coffee Statistics," ICO, London. Available at http://www.ico.org/historical.asp, accessed 29 July 2010. This document is authorized for use only by Mayra Rodriguez in MGMT 672, CMBA Summer 2021 taught by Dr. Bart Sharp, Northern Illinois University from Apr 2021 to Oct 2021.For the exclusive use of M. Rodriguez, 2021. Page 12 9B10M073 Exhibit 5 STARBUCKS' ESTIMATED MARKET SHARE (2007-2009) -Starbucks Dunkin' Donuts McDonald's 12.0% 10.0% 8.0% 6.0% 4.0% 2.0% 0.0% Jan-07 Jan-08 Jan-09 Source: Big Research, "Consumer Intentions s & Actions (CIA) Survey," May 2009. Available at http://www.bigresearch.comews/big052809.htm, accessed 29 July 2010 Exhibit 6 STARBUCKS' STORES AND REVENUES FROM GROCERY CHANNEL (2002-2009) US International - Grocery revenues 45,000 $400,000 40,000 $350,000 35,000 $300,000 30,000 $250,000 25,000 Grocery stores $200,000 Revenues in $1.000 20,000 $150,000 15,000 10,000 $100,000 5,000 $50,000 0 2002 2003 2004 2005 2006 2007 2008 2009 Source: Annual reports 2002-2009. This document is authorized for use only by Mayra Rodriguez in MGMT 672, CMBA Summer 2021 taught by Dr. Bart Sharp, Northern Illinois University from Apr 2021 to Oct 2021.For the exclusive use of M. Rodriguez, 2021. Page 13 9B10M073 Exhibit 7 COMPOSITE COFFEE PRICE (1998-2010) ICO Composite Price 140 120 - 100 80 US cents per lb (yr average) 60 40 20 0- 1998 1999 2000 2001 2002 02 2003 2004 2005 2006 2007 2008 8 2009 2010 Year Source: International Coffee Organization (ICO), "Historical Coffee Statistics," ICO, London. Available at http://www.ico.org/historical.asp, accessed 29 July 2010. Exhibit 8 STARBUCKS' REVENUE VERSUS ABSOLUTE STORE GROWTH Foreign sales Domestic sales Total sales --Foreign stores Domestic stores - Total stores 12 - 18,000 16,000 10 14,000 12,000 10,000 Number of Stores Sales (in billions) 8,000 6,000 - 4,000 N 2,000 1993 1994 1995 1996 1997 1998 1999 2000 2001 2002 2003 2004 2005 2006 2007 2008 2009 Year Source: Annual reports Starbucks 1993-2009 and Thomson Reuters Datastream. This document is authorized for use only by Mayra Rodriguez in MGMT 672, CMBA Summer 2021 taught by Dr. Bart Sharp, Northern Illinois University from Apr 2021 to Oct 2021.For the exclusive use of M. Rodriguez, 2021. Page 15 9B10M073 Exhibit 11 PACE OF STARBUCKS' INTERNATIONALIZATION Foreign subsidiaries Home subsidiaries Log. (Foreign subsidiaries) Log. (Home subsidiaries) 90.0% 7 80.0% 70.0%- % Growth subsidiaries 60.0%- 50.0% 40.0% 30.0% 20.0% 10.0% 0.0% 5.89 6.24 6.43 6.91 7.52 7.57 7.88 8.00 8.12 9.14 10.39 10.69 10.85 12.77 14.27 14.35 14.35 1994 1993 2008 2000 1998 2009 1997 1996 1995 1999 2002 2003 2001 2004 2007 2005 2006 Performance (Annual ROA, ascending) Source: Annual reports Starbucks 1993-2009 and Thomson Reuters Datastream. Exhibit 12 RHYTHM OF STARBUCKS' INTERNATIONALIZATION Domestic growth Foreign growth -Log. (Domestic growth) -Log. (Foreign growth) 1.50 1.00 0.50 4Y Kurtosis Growth (country) 147 8.61 10.66 12.05 0.50 1994 1997 1998-2001 2006-2009 2002-2005 1.00- 1.50- 2.00- Performance (4Y ROA, ascending) Source: Annual reports Starbucks 1993-2009 and Thomson Reuters Datastream. This document is authorized for use only by Mayra Rodriguez in MGMT 672, CMBA Summer 2021 taught by Dr. Bart Sharp, Northern Illinois University from Apr 2021 to Oct 2021.For the exclusive use of M. Rodriguez, 2021. Page 16 9B10M073 Exhibit 13 SCOPE OF STARBUCKS' INTERNATIONALIZATION (1993-2009) Foreign countries Log. (Foreign countries) 250.0% 200.0% 150.0% % Growth countries 100.0% 50.0% ILL 0.0% 5.89 6.24 6.43 6.91 7.52 7.57 7.88 8.00 8.12 9.14 10.39 10.69 10.85 12.77 14.27 14.35 14.35 1994 1993 2008 2000 1998 2009 1997 1996 1995 1999 2002 2003 2001 2004 2007 2005 2006 Performance (Annual ROA, ascending) Source: Annual reports Starbucks 1993-2009 and Thomson Reuters Datastream. Exhibit 14 SCOPE OF STARBUCKS' INTERNATIONALIZATION (1996-2009) Foreign countries Log. (Foreign countries) 250.0% ] 200.0% 150.0% % Growth countries 100.0% 50.0% 0.0% 6.43 6.91 7.52 7.57 7.88 8.00 9.14 10.39 10.69 10.85 12.77 14.27 14.35 14.35 2008 2000 1998 2009 1997 1996 1999 2002 2003 2001 2004 2007 2005 2006 Performance (Annual ROA, ascending) Source: Annual reports Starbucks 1993-2009 and Thomson Reuters Datastream This document is authorized for use only by Mayra Rodriguez in MGMT 672, CMBA Summer 2021 taught by Dr. Bart Sharp, Northern Illinois University from Apr 2021 to Oct 2021.For the exclusive use of M. Rodriguez, 2021. Page 2 9B10M073 THE COFFEE INDUSTRY The energizing effect of the coffee bean was thought to have been discovered in Yemen' and Ethiopia* in the 13th century. By the 16th century, this discovery had reached other parts of the Middle East, Persia, Turkey and Northern Africa and eventually spread to Europe, Indonesia and the Americas.' In the 17th century, coffee houses, which were already popular in Europe, began to open in the United States. " At this time, coffee was sold in the form of whole beans out of a barrel, intended to be ground by the consumer at home. By the late 1990s, the coffee industry accounted for $80 billion in sales. ' The largest markets were the European Union (35 per cent), the United States (25 per cent) and Japan (9 per cent). By 2010, 501 billion cups of coffee were being consumed yearly, and retail sales had grown by 6.9 per cent annually to reach $48.2 billion. "Worldwide consumption was expected to be 130.03 million bags (at 60 kg per bag) according to a 2010/11 forecast by Fortis Bank." According to the International Coffee Organization (ICO), the historical annual growth rate of coffee consumption was approximately 2.5 per cent. This rate fell to 1 per cent in 2009/10, during the economic recession. In the 1970s, when the economy was struggling, U.S. consumption of coffee dropped from 33.4 to 26.7 gallons per capita."Some commentators argued this decrease also could have been a consequence of both media reports stressing the downsides of caffeine and the high price of coffee at that time (well above $1 per pound). Exhibit 3 illustrates coffee consumption in kilograms per capita per year, and Exhibit 4 shows coffee consumption in metric tons per year. DEMAND FOR SPECIALTY COFFEE Since the early 1990s, the popularity of specialty coffee had been on the rise. Between 1995 and 2008, the percentage of U.S. adults drinking specialty coffee on a daily basis had risen from around 3 per cent to around 17 per cent." Between 2001 and 2007, the sales of specialty coffee in the United States had risen from $8 billion to $13 billion. " Coffee imported by specialty roasters increased from one million 60-kg bags in 1985 to more than 2.7 million bags in 1999." In this same period, the share of specialty coffee retail sales (compared with total coffee retail sales) in the United States grew from 5 per cent to 37 per cent. " From the early 2000s, coffee consumers had shown an increasing preference for premium coffee over regular coffee and had been willing to pay a higher price for premium coffee. The beans used for Bennett Alan Weinberg and Bonnie K. Bealer, The World of Caffeine: The Science and Culture of the World's Most Popular Drug, Routledge, New York, 2001. John K. Francis, "Coffee arabica L. RUBIACEAE," factsheet of the U.S. Department of Agriculture, Forest Service. Available at http://www.fs.fed.us/global/iitf/pdf/shrubs/Coffee%20arabica.pdf, accessed July 29, 2010 5 Bennett Alan Weinberg and Bonnie K. Bealer, Food Info, "History of Coffee." Available at http://www.food-info.net/uk/products/coffee/hist.htm, accessed July 29, 2010. Mark Pendergrast, Uncommon Grounds: The History of Coffee and How It Transformed Our World, Basic Books, New York, 1999, p. 418. "Product Profile: Coffee, " Third United Nations Conference on the Least Developed Countries, May 16, 2001, pp. 4-6. Mike Chronos, "Which Countries Consume the Most Coffee?" Available at http://ezinearticles.com/? Which-Countries- Consume-the-Most-Coffee?&id=3876423, accessed July 29, 2010. 10 Packaged Facts, Coffee and Ready-to-Drink Coffee in the U.S.: The Market and Opportunities in Retail and Foodservice, 6th edition, Packaged Facts, Rockville, MD, 2010. " Reuters, "Fortis NL Trims Global Coffee Surplus Forecast, " May 24, 2010. 12 United States Department of Agriculture, "U.S. Agriculture-Linking Consumers and Producers," available at http://www.usda.govews/pubs/fbook98/ch1a.htm, accessed July 29, 2010. 13 AccuVal Associates, Inc., "Coffee Beans: Slowly Cooling Supply Heating Up Pricing." Available at http://www.accuval.net/insights/industryinsights/detail.php?ID=101, accessed 29 July 2010. 14 /bid. 5 Specialty Coffee Association of America (SCAA), "1999 Coffee Market Summary," SCAA, Long Beach, CA, November 1999, p. 2. 16 /bid. This document is authorized for use only by Mayra Rodriguez in MGMT 672, CMBA Summer 2021 taught by Dr. Bart Sharp, Northern Illinois University from Apr 2021 to Oct 2021.For the exclusive use of M. Rodriguez, 2021. Page 3 9B10M073 specialty coffee (Arabica instead of Robusta) have higher quality, are richer in flavor and contain half as much caffeine as commercially mass-produced coffee. From 1981 to 2006, the market share of specialty coffee increased from 1 per cent to 20 per cent. In the United States, specialty coffee accounted for $13.65 billion in sales in 2009, approximately one-third of the $40 billion U.S. coffee industry." Coffee shops often served specialty coffee and had enjoyed a fivefold increase of sales on this product line between 2000 and 2010.19 INCREASING COMPETITION, RISING SUPPLIER PRICES AND FAIR TRADE As of 2006, Starbucks faced severe competition in both its home and overseas markets. Between 2000 and 2005, the number of coffee shops in the United States increased by 70 per cent, reaching a total of 21,400: approximately one shop for every 14,000 Americans. The number of independently operated coffee shops fell from 61 per cent in 1999 to 52 per cent in 2001." Starbucks acknowledged that its primary competitors for coffee beverage sales were quick-service restaurants and specialty coffee shops. Starbucks had numerous competitors in all markets in which the company operated. On the one hand, Starbucks faced competition from domestic coffeehouses such as Caribou Coffee (in the eastern and mid-west United States) and Diedrich Coffee (in California and the western United States). The company also faced increasing worldwide threats from international retailers such as Mcdonald's. Nowhere was the severe competition more conspicuous than with Mcdonald's entry into the specialty coffee sector: Mcdonald's offered premium coffee, only cheaper. Mcdonald's already had 14,000 stores in the United States and, compared with Starbucks, catered to a wider range of demographic segments. It also enjoyed increased traffic from its variety of well-established breakfast options. Mcdonald's coffee sales increased 15 per cent in 2006. Starbucks did not initially consider Mcdonald's to be a competitor, believing that its own approach to marketing coffee was distinct. Many Starbucks customers, however, were also customers of Mcdonald's and other fast-food chains. In January 2008, Mcdonald's made an aggressive foray in the battle for high-end coffee drinkers when it announced it would install coffee bars in all 14,000 of its U.S. locations. Aggressive marketing campaigns also emphasized the large cost differential. That said, Starbucks and Mcdonald's did collaborate on the distribution of one of Starbucks' brands: Mcdonald's brewed Seattle's Best brand coffee, a brand owned by Starbucks. Starbucks became concerned by these competitor moves, and Schultz was reported as having said that the company itself was to blame: its focus had been more on expansion and not on improving customer service. " To get the company back on track, Starbucks said it would slow the pace of U.S. store growth and renew its focus on its store-level unit economics." As a counter-maneuver against Mcdonald's, "7 Ted Lingle, "The State of the Specialty Coffee Industry," Tea and Coffee Trade Journal, July 2007, accessed August 8, 2008. Available at http://www.allbusiness.com/manufacturing/food-manufacturing-food-coffee-tea/4510403-1.html, accessed July 29, 2010. 18 Dan Bolton, "Coffee Industry Shifts Under Tough Economy, " Specialty Coffee Retailer, August 2009. Avaliable at http://www.specialty- coffee. com/ME2/Audiences/dirmod. asp?sid=&nm=&type=MultiPublishing&mod=Publishing Titles&mid=8F3A7027421841978 F18BE895F87F791&AudID=464620AE3F20454894C8CB7CEF72A481&tier=4&id=71C474258D2F46AEAD2BA59307E800 2B, accessed July 29, 2010. 19 Specialty Coffee Association of America, The Mintel Coffee Report, 2006. 20 Dan Bolton, "Coffee Industry Shifts Under Tough Economy, " Specialty Coffee Retailer, 21 Specialty Coffee Association of America Report 1999. 22 Isabel Goncalves, "Starbucks' Schultz Back as Mcdonald's Increases Competition," International Business Times, January 7, 2008. Available at http://www.ibtimes.com/articles/20080107/starbucks-schultz-mcdonalds.htm, accessed July, 29 2010. 23 Ibid. This document is authorized for use only by Mayra Rodriguez in MGMT 672, CMBA Summer 2021 taught by Dr. Bart Sharp, Northern Illinois University from Apr 2021 to Oct 2021.For the exclusive use of M. Rodriguez, 2021. Page 4 9B10M073 Starbucks launched a cheaper alternative to the market: Starbucks Via, an instant coffee. With the launch of this instant-brew coffee, Starbucks entered a new growth market, the $21 billion global instant coffee category." Starbucks had earlier launched a drive-through service, which had been an important element of Mcdonald's service. As a result of these recent initiatives, Starbucks' overall market share remained resilient (see Exhibit 5). Another threat to Starbucks was the rise in purchases of specialty coffee for use at home. During the 1990s, Starbucks foresaw this trend and stepped into the specialty coffee grocery channel. However, also stepping into this channel were the big conventional supermarket coffee producers: Procter & Gamble, Nestle, Kraft Foods and Sara Lee. Starbucks introduced bottled frappuccino and, later, in 1996, introduced espresso drinks for the grocery channel in partnership with Pepsi-Cola. In 1997, Starbucks introduced a home espresso machine and in 1998 signed a licensing agreement with Kraft Foods to market and distribute the Starbucks' specialty coffee beans to more than 25,000 American grocers. In 2003, Starbucks acquired the Seattle Coffee Company and, with it, two brands of specialty coffee in the grocery sector. The impact on domestic sales is shown in Exhibit 6. In 2008, the total American specialty coffee grocery channel accounted for $915 million, 27.7 per cent of total grocery coffee sales. This market share grew by an annual growth rate of 12 per cent, which was high compared to the annual growth rate of 3 per cent for traditional coffees.25 In addition to the increased competition in the specialty coffee space, Starbucks also faced pressures from the coffee bean supply chain. The average wholesale price for coffee had increased twofold between 2001 and 2010, from US$0.41 per pound at its lowest point in September 2001 to US$1.42 per pound in June 2010 (see Exhibit 7). This price increase was the result of a constant increase in coffee consumption (see Exhibit 4) combined with a shortfall in coffee available for export. Production in the largest coffee- producing country (Brazil) dropped dramatically in 2004, following a similar dramatic drop for the second- largest coffee producer (Vietnam) in 2003. Brazil's production fell from 48.5 million bags to 28.5 million bags, and Vietnam's production fell from 14.77 million bags to 11.25 million bags." The production levels of the largest coffee-producing countries historically had a huge effect on coffee prices. Back in 1975, Brazil (the largest producer at that time) had been struck by a severe frost. The world price doubled overnight and soared to eight times its pre-frost level." Starbucks also faced pressure to embrace fair trade coffee. The popularity of fair trade coffee had affected the whole coffee industry. Under a fair trade agreement, producers were guaranteed a fair price consisting of a floor price of $1.26 per pound and an additional $1.41 per pound for certified organic coffee.From 2002 to 2004, the United States Agency for International Development (USAID) invested more than $57 million in coffee projects in more than 18 countries in Latin America, East Africa and Asia in an effort to create sustainable supplies of coffee. In the mid-1990s, the coffee industry attracted criticism on 4 Lisa Baertlein, "Starbucks Debuts Via Instant Coffee in U.S., Canada, " Reuters, September 28, 2009. 25 Dan Bolton, "Ten 2010 Trends: 10. Grocery Growth," Specialty Coffee Retailer, August 2009. Available at http://www.specialty- coffee.com/ME2/Audiences/dirmod. asp?sid=&nm=&type=MultiPublishing&mod=Publishing Titles&mid=8F3A7027421841978 F18BE895F87F791&tier=4&id=OF30847112644743966COFF07866405&AudID=464620AE3F20454894C8CB7CEF72A48 1, accessed July 29, 2010 26 Ibid. 27 John Madely, "Coffee Price Rise Is Just a Hill of Beans," The Observer, April 4, 2004. Available at http://www.guardian.co.uk/business/2004/apr/04/theobserver.observerbusiness11, accessed: July 29, 2010. 28 Global Exchange, "Frequently Asked Questions about Fair Trade Coffee," 2009. Available at http://www.globalexchange.org/campaigns/fairtrade/coffee/faq.html, accessed July 29, 2010. 29 United States Agency for International Development (USAID), "USAID Supports Coffee Growers Around the Globe," USAID, Washington, September 15, 2004. Available at http://www.usaid.gov/press/factsheets/2004/fs040915.html, accessed July 29, 2010. This document is authorized for use only by Mayra Rodriguez in MGMT 672, CMBA Summer 2021 taught by Dr. Bart Sharp, Northern Illinois University from Apr 2021 to Oct 2021.For the exclusive use of M. Rodriguez, 2021. Page 5 931 ON! 073 environmental and economic grounds, which placed the supply of the Arabica bean at risk.30 The solution to these issues lay in the use of differently cultivated coffee beans: certied organic coffee beans that were environmental friendly, so-called shade-grown coffee. These coffee beans had been shown to have a positive influence on wildlife and bird habitat, and they offered a higher compensation to third-world coffee farmers. One problem, however, was that these differently cultivated beans often did not meet the same quality level as other beans. Starbucks hesitated in switching to different coffee beans." In early 2000, Starbucks had been publicly blamed for its conventional coffee cultivation, which reportedly had involved child labor.32 In that same year, Starbucks signed a licensing agreement to sell fair trade, organic and shade- grown coffee in the United States and Canada. This agreement was the start of a new direction in Starbucks' strategy. In 2001, Starbucks committed to purchase one million pounds of fair tradecertied coffee and donated money to support the well-being of coffee farmers. In 2002, the rst corporate social responsibility program report was published, and a licensing agreement was signed to sell fair trade coffee in all Starbucks' operating countries. In 2005, Starbucks increased its fair trade coffee purchasing to 10 million pounds and thus became North America's largest buyer of fair trade coffee. Fair trade coffee sales in the United States grew by 32 per cent in 2008.33 STARBUCKS' GROWTH, INTERNATIONALIZATION AND PERFORMANCE Between 1993 and 2009, Starbucks experienced substantial growth. In 2007, Starbucks had a presence in 56 countries through approximately 17,000 stores. Revenues grew from $160 million in 1993 to $10 billion in 2009. Starbucks originally started within the US. market and expanded abroad when it perceived the domestic market to be saturated. The first move Starbucks made outside of the United States was to expand into Canada in the early 1990s. From 1996, the company started to enter more distant countries in the F ar East, such as Japan, Singapore, the Philippines, Taiwan and Thailand. Over the period from 1996 to 2009, the company entered 56 countries (see Exhibit 1). When entering a foreign market, Starbucks' strategy was to retain its core service and product offering as much as possible, while adapting to local demands in the host country, where appropriate. Examples of local adaptations included serving tea in Japan and China and omitting the siren from the logo in Muslim countries. Depending on knowledge gained about the host market and, in particular, the perceived level of risk, Starbucks adopted various modes of entry, using local partners and licensed joint ventures in certain countries and company-operated wholly owned subsidiaries in other countries. The company often ended up buying out the local partner where joint ventures were successful and the local market had potential. Starbucks' revenues grew, on average, 30 per cent per year between 1993 and 2009, in line with the company's growth in the number of stores (see Exhibit 8). Exhibit 9 shows the relationship between relative growth of numbers of stores and revenues. Although the company as a whole expanded, the speed of expansion diminished over the years. In the early 1990s, the growth in stores (and revenues) was approximately 70 per cent. In 1996 and 1997, the year-on-year growth increased in foreign stores, but 3\" Daniele Giovannucci. Sustainable Coffee Survey of the North American Sgecia'y; Coffee industry. Specialty Coffee Association of America (SCAA) and North American Commission for Environmental Cooperation, 2001, p. 7. 3' Alison Stanley, \"Starbucks Coffee Company,\"business case, Trustees of Dartmouth College, Tuck School of Business, Hanover, NH. 2002. p. 15. 32 Global Exchange. \"Frequently Asked Questions about Fair Trade Coffee.\" 2009. Available at http://wwwglobalexchange.org/campaig'is/fairtrade/coffee/'faq.html. accessed July 29. 2010. 33 K. Jesse Singerman and Tony Olson, \"Sustained Demand for Fair Trade Products in Economic Downturn,\" TransFair USA. November 2009.Available at httoJ/ivwwtransfairusa.org/content/aboutews_0910.php. accessed July 29, 2010. This document is authorized for use only by Mayra Rodriguez in MGMT 672, CMBA Summer 2021 taught by Dr. Bart Sharp, Northern Illinois University from Apr 2021 to Oct 2021 . For the exclusive use of M. Rodriguez, 2021. Page 6 931 0M 073 declined in domestic stores. After a period of relatively high overall growth (1993 to 2002), the growth of the company slowed to approximately 20 per cent per year (from 2003 to 2008). Finally, growth of stores dropped even further in 2009 (see Exhibit 9). This decline coincided with the global recession, intensifying competition (particularly in the home market) and supply chain pressures. Measuring performance through return on assets (ROA) gives insight into long-term protability.34 Exhibit 10 shows the relationship between Starbucks' RCA and its relative growth in the number of stores and countries entered between 1993 and 2009. Between 1996 and 2000, Starbucks had a period of high international growth, which was accompanied by moderate performance. During this period, the rate of growth of foreign stores consistently exceeded the rate of growth of domestic stores. ROA ranged between 7 per cent and 10 per cent. 2003 and 2008 was a more stable period for new stores and countries entered, and this was accompanied by a higher ROA. In this phase, ROA reached 15 per cent, but the rate of growth of foreign stores fell to that of domestic stores. Between 2008 and 2009 the performance of the company dropped markedly compared with previous years: ROA fell back to approximately 7 to 8 per cent, and the number of new countries entered approached zero. PAGE OF STARBUCKS' INTERNATIONALIZATION Pace of internationalization was measured by the relative growth in the number of foreign stores per year. Exhibit 11 shows the relationship between the pace of Starbucks' internationalization and its performance over the 17 years from 1993 to 2009 inclusive. The X-axis represents performance (ascending), and the Y- axis represents the pace of internationalization. Domestic and foreign growth rates are shown as separate lines. The downward slope indicates a negative association between pace and performance. The slopes for domestic and foreign expansion bear resemblance, although the effect for foreign expansion is more pronounced than domestic expansion. The best performing years were the years characterized by a slower pace of internationalization (i.e. 2004, 2005, 2006 and 2007). Four years (i.e. 1993, 1997, 1998 and 2001) stand out om this trend. In 1993, the pace of Starbucks' internationalization was moderate, but ROA was at its second lowest level in the 17-year period. One explanation for this low ROA could be that year's 115 per cent increase in firm assets, partly as a result of the opening of a second roasting plant. Conversely, the pace of internationalization was high in 1997 and 1998 but ROA was only moderate. In this period, Starbucks acquired Seattle Coffee Company in the United Kingdom, which included 65 stores already generating revenue. The acquisition enabled Starbucks to expand at a faster pace in the United Kingdom, without loss of performance. In 2001, Starbucks' high pace of internationalization was accompanied by an above-average ROA of 10.85 per cent. The reason for these results may lie in Starbucks' expansion strategy announced in the previous year's annual report: Starbucks strategy for expanding its retail business is to increase its market share in existing markets and to open stores in new markets where the opportunity exists to become the leading specialty coffee retailer.35 In 2001, Starbucks opened 252 additional stores in the United Kingdom. These UK. stores accounted for approximately 75 per cent of the total expansion for that year (a total of 337 new stores were opened in 2001). In addition, Starbucks entered Thailand with the opening of 25 stores and Australia with the 3\" Michael A. Hitt et at. "international Dn/ersication: Effects on innovation and Firm Performance in Product-diversied Firms, " caden__rg of Management Joumaf, vol. 40, no. 4, pp. 76%798. 35 Starbucks Annual Report. 2000. This document is authorized for use only by Mayra Rodriguez in MGMT 672, CMBA Summer 2021 taught by Dr. Bart Sharp, Northern Illinois University from Apr 2021 to Oct 2021 . For the exclusive use of M. Rodriguez, 2021. Page 7 931 ON! 073 opening of 18 stores. These three countries accounted for approximately 90 per cent of Starbucks' international expansion in that year. RHYTHM OF STARBUCKS' INTERNATIONALIZATION Rhythm refers to the regularity by which a company such as Starbucks internationalizes. It is an indicator of the variation in international expansion over time. Exhibit 12 shows the relationship between Starbucks' rhythm of internationalization and performance in four-year blocks between 1994 and 2009. The rhythm of Starbucks' internationalization is measured through the kurtosis of the number of foreign stores over each four-year time period.36 A higher kurtosis implies a more irregular rhythm, and a lower kurtosis implies a more regular rhythm. The first two blocks (ie. 1994-1997 and 1998-2001) were characterized by high volatility in Starbucks' internationalization. These two blocks both represented high-growth periods for the company, particularly in terms of new countries entered (see Exhibit 11). Correspondingly, performance was lower in these periods. Performance was highest in the second two blocks (i.e., 2002-2005 and 2006- 2009). The highest four-year ROA appears in the period 2002-2005. In the two periods 2002-2005 and 2006-2009, the rhythm of international expansion became much more regular and less volatile. During this phase of stable growth, almost no volatility occurred, and Starbucks was able to consolidate and improve its performance. Exhibit 12 shows a link between a lower kurtosis and higher returns for Starbucks. Downward slopes are visible for both domestic and foreign stores: for both national and international expansion, a more regular rhythm is associated with higher ROA. The trend line for the slope of the foreign kurtosis is steeper, implying performance is potentially more sensitive to the rhythm of foreign expansion than to domestic expansion. Contrary to the overall pattern, the company's domestic expansion was extremely regular between 1994 and 1997, yet Starbucks experienced a period of relatively low ROA. However, the foreign expansion path in the same time period was much more irregular. Again, the rhythm of the foreign expansion appears to influence Starbucks' RCA to a larger extent than domestic rhythm. The foreign countries entered during this irregular period happened to be those countries where the company faced higher cultural differences for the rst time: those in the Far East and the Middle East (see Exhibit 1). In the period 2006-2009, a higher performance might have been expected when compared with the period of 2002-2005 because the company had a more regular expansion; however, Exhibit 12 shows the expected higher performance was not the case. This latter period coincided with the global economic recession and intensifying competition. SCOPE OF STARBUCKS' INTERNATIONALIZATION The geographical scope, or scope, is measured by the relative growth of the number of countries added to the company's portfolio over a given period of time. The geographical scope of Starbucks' expansion path is shown in Exhibit 13. A downward slope implies a negative association between scope and returns, 35 Formula to calculate the rhythm of the internationalization process, according to Freek Vermeulen and Harry Barkema, "Pace, Rhythm, and Scope: Process Dependence in Building a Protable Multlrational Corporation, " Strategic Management Journal 2002. vol. 23, pp. 637w653. Note: n = number of observations: it,- = number of expansions in year i: s = standard deviation of the number of expansions. Kur'iosis This document is authorized for use only by Mayra Rodriguez in MGMT 672, CMBA Summer 2021 taught by Dr. Bart Sharp, Northern Illinois University from Apr 2021 to Oct 2021 . For the exclusive use of M. Rodriguez, 2021. Page 8 931 ON! 073 which, however, was not the case; the slope is rather at. In the rst three years of the analysis (1993- 1995), Starbucks was solely represented in the United States and Canada; the company had not yet internationalized into countries outside North America. Exhibit 14 shows the same analysis with these years excluded. The graph clearly shows a downward slope. Once Starbucks embraced international expansion in 1996 and thereafter, higher returns were generally gained in the years in which the scope of internationalization was low. However, Starbucks experienced some exceptions to this general rule. In 1998, the scope of Starbucks' internationalization was high. That same year, Starbucks acquired the Seattle Coffee Company, which provided 65 stores and a presence in prime locations in the United Kingdom. This one-off acquisition enabled Starbucks to expand with a broader geographical scope and to tap into existing revenue channels in the United Kingdom. Similarly, in 2000, the trend line suggests Starbucks should have had a higher performance because it had relatively low country growth. As seen in Exhibit 11, pace was moderately high that year. Conversely, in the years 2008 and 2009, Starbucks had relatively low new country growth but performance was suppressed. Again, these results can be explained by the economic recession. RATIONALIZATIOH AND THE POST-RATIOHALIZATION DECISION Starbucks' success in growing its business at home and abroad was legendary. However, the company had received criticism on a number of onts: for growing too fast, for cannibalizing turnover in closely located stores, for decreasing product quality and company image, and for driving out small, independent competitors.\" Furthermore, after 2007, demand for Starbucks' products was badly hit by the global economic recession. All in all, these factors led the company to embark on a rationalization program between 2008 and 2010 and to close nearly 1,000 company-operated stores. According to Starbucks' 2009 annual report: Starbucks actions to rationalize its global store portfolio have included the planned closure of nearly 1,000 Company-operated stores globally. At the end of scal 2009, nearly all of the approximately 800 US Company-operated stores, 61 stores in Australia and 41 Company-operated stores in other International markets had been closed. The remaining International store closures are expected to be completed by the end of scal 2010. These closures resulted in approximately $580 million in cost savings but also affected earnings by lease termination and severance costs. Approximately 70 per cent of the stores that were closed had been open for fewer than three years. Now, in mid-2010, as CEO Schultz looked forward, he needed to decide again how to approach international markets. The world was gradually emerging from the economic downturn, and prospects for growth were improving. Starbucks was now faced with some critical strategic decisions: Should the company resume its international expansion and once again intensify its commitments in overseas markets? If so, what approach should the company take? Had the pace, rhythm and scope of its previous internationalization in the coffee industry affected company performance? How should Starbucks formulate and execute its international strategy going forward? 37 "Store Wars: Cappuccino Kings, \" BBC News June 9. 2004 (rst transmitted February 12. 2003). This document is authorized for use only by Mayra Rodriguez in MGMT 672, CMBA Summer 2021 taught by Dr. Bart Sharp, Northern Illinois University from Apr 2021 to Oct 2021 . For the exclusive use of M. Rodriguez, 2021. 9B10M073 Page 9 Exhibit 1 STARBUCKS' INTERNATIONALIZATION TIMELINE Japan Korea Indonesia Liaoning: Dalian Singapore Lebanon Mexico Liaoning: UAE Puerto Rico Chengdu Hong Kong Greece Philippines Macau Southern Liaoning: Xi'an Shenzhen Taiwan Bahrain Argentina Southern Thailand . Scotland Portugal Guangdong England Wales France Brazil Bulgaria Switzerland Cyprus Poland 1996 1996 1997 1998 1999 2000 2001 2002 2003 2004 2005 2006 2007 2008 2009 . Saudi Arabia Chile Liaoning: Qingdao Qatar Peru The Bahamas Australia Turkey Ireland Liaoning: Hubei . Shanghai Czech Republic Kuwait Germany Russia . Beijing & Tianjin . Spain Romania . Malaysia Oman Jordan . Egypt . New Zealand Austria Northern Ireland Source: Annual reports Starbucks 1993-2009 Exhibit 2 STARBUCKS' STOCK VERSUS MARKET PERFORMANCE (INDEX) - - - NASDAQ COMPOSITE - PRICE INDEX - STARBUCKS 600 0% 5000% 4000% % Growth 300 0% 2000% 100 0% 1992 1993 1994 1995 1996 1997 1998 1999 2000 2001 2002 2003 2004 2005 2006 2007 2008 2009 2010 Year Source: Thomson Reuters Datastream (Monthly index, July, 1992 = 100%) This document is authorized for use only by Mayra Rodriguez in MGMT 672, CMBA Summer 2021 taught by Dr. Bart Sharp, Northern Illinois University from Apr 2021 to Oct 2021
