Answered step by step
Verified Expert Solution
Link Copied!

Question

1 Approved Answer

Using SAS, answer the following Question. 5. The amount of rain for three months (June, July, and August) was recorded for each of three cities.

Using SAS, answer the following Question.

image text in transcribed

5. The amount of rain for three months (June, July, and August) was recorded for each of three cities. Using the data in the following table, create a SAS data set (RAIN) containing the variables CITY, RAIN_JUNE, RAIN_JULY, and RAIN_AUGUST. RAIN_JUNE RAIN_JULYRAIN_AUGUST CITY Trenton Newark Albany 25 27 21 30 23 18 27 a. Create four additional variables in this data set: AVERAGE. PERCENT_JUNE, PERCENT_JULY, and PERCENT_AUGUST. AVERAGE is the average of the rain for the three months. Each of the PERCENT variables is computed as rainfall for the month as a percent of the AVERAGE. For example, PERCENT_JUNE would be 23 26 100x Report the results. b. Provide a listing of the data set in alphabetical order of CITY, with CITY as the ID variable c. Compute the mean, standard deviation, and the 95% confidence interval for the three RAIN variables (with all statistics printed with two decimal places) 5. The amount of rain for three months (June, July, and August) was recorded for each of three cities. Using the data in the following table, create a SAS data set (RAIN) containing the variables CITY, RAIN_JUNE, RAIN_JULY, and RAIN_AUGUST. RAIN_JUNE RAIN_JULYRAIN_AUGUST CITY Trenton Newark Albany 25 27 21 30 23 18 27 a. Create four additional variables in this data set: AVERAGE. PERCENT_JUNE, PERCENT_JULY, and PERCENT_AUGUST. AVERAGE is the average of the rain for the three months. Each of the PERCENT variables is computed as rainfall for the month as a percent of the AVERAGE. For example, PERCENT_JUNE would be 23 26 100x Report the results. b. Provide a listing of the data set in alphabetical order of CITY, with CITY as the ID variable c. Compute the mean, standard deviation, and the 95% confidence interval for the three RAIN variables (with all statistics printed with two decimal places)

Step by Step Solution

There are 3 Steps involved in it

Step: 1

blur-text-image

Get Instant Access to Expert-Tailored Solutions

See step-by-step solutions with expert insights and AI powered tools for academic success

Step: 2

blur-text-image_2

Step: 3

blur-text-image_3

Ace Your Homework with AI

Get the answers you need in no time with our AI-driven, step-by-step assistance

Get Started

Recommended Textbook for

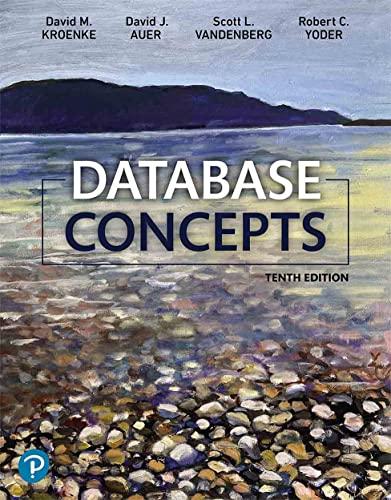
Database Concepts

Authors: David Kroenke, David Auer, Scott Vandenberg, Robert Yoder

10th Edition

0137916787, 978-0137916788

More Books

Students also viewed these Databases questions

Question

Are the rules readily available?

Answered: 1 week ago

Question

In an Excel Pivot Table, how is a Fact/Measure Column repeated?

Answered: 1 week ago