Using Statistics to Accept/ Reject Hypotheses Start Assignment Due Wednesday by 11:59pm Points 10 Submitting a file upload File Types ppt, doc, txt, pptx, pdf,
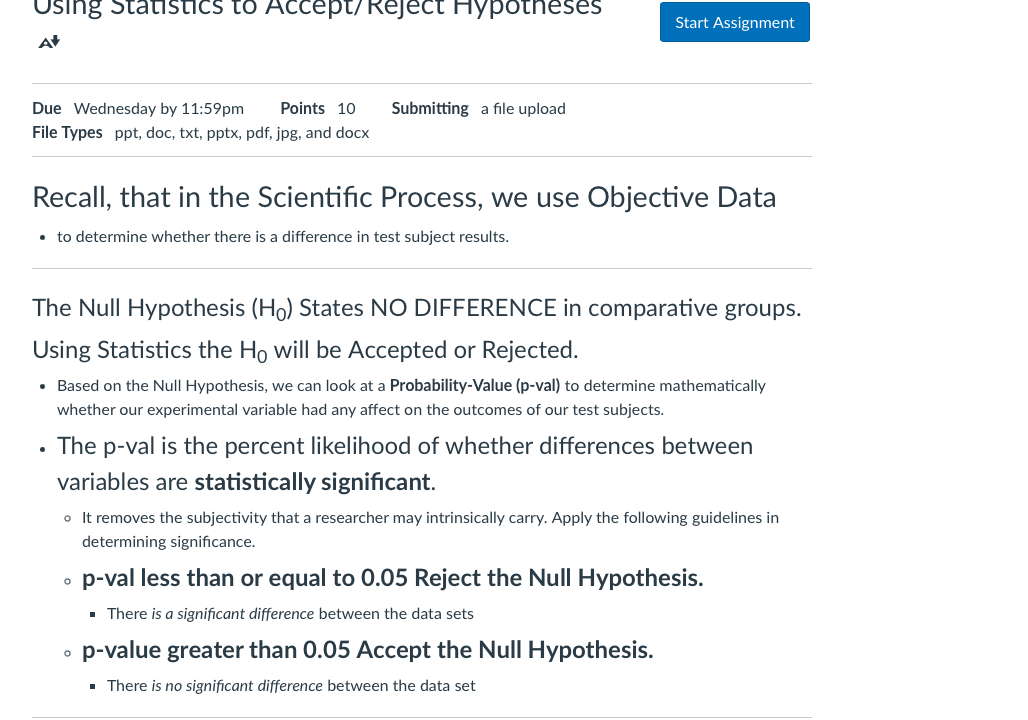
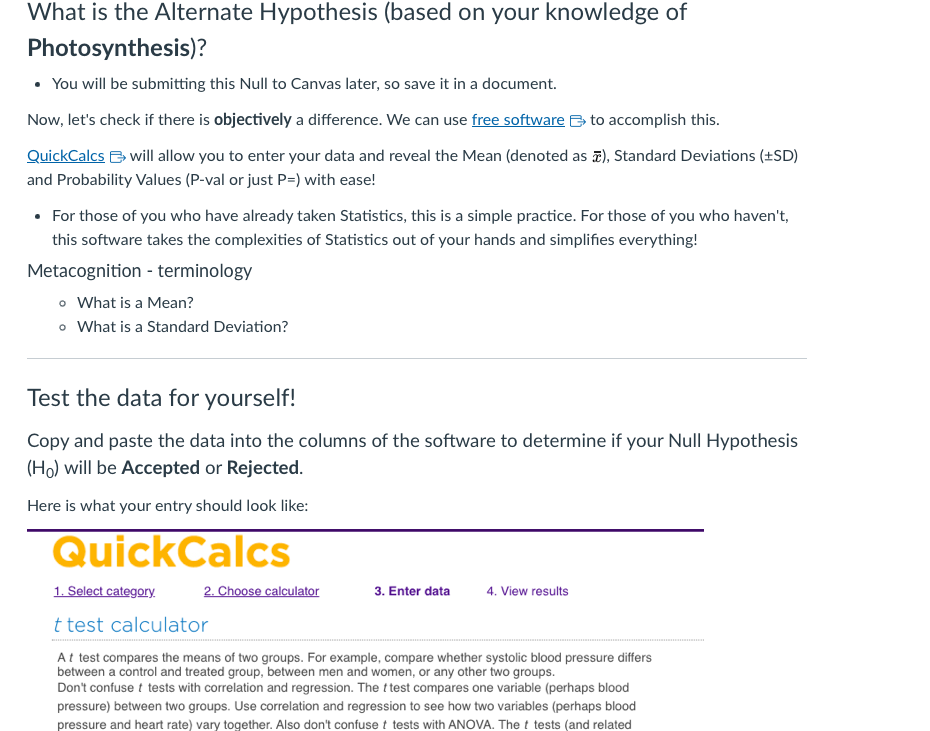
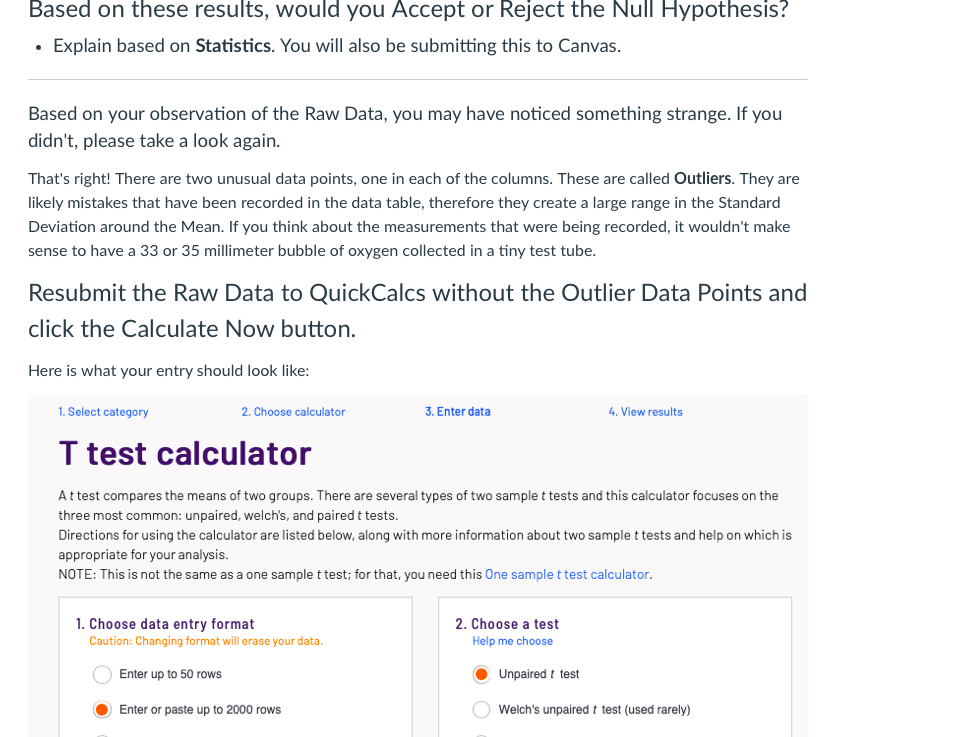
Using Statistics to Accept/ Reject Hypotheses Start Assignment Due Wednesday by 11:59pm Points 10 Submitting a file upload File Types ppt, doc, txt, pptx, pdf, jpg, and docx Recall, that in the Scientific Process, we use Objective Data . to determine whether there is a difference in test subject results. The Null Hypothesis (Ho) States NO DIFFERENCE in comparative groups. Using Statistics the Ho will be Accepted or Rejected. . Based on the Null Hypothesis, we can look at a Probability-Value (p-val) to determine mathematically whether our experimental variable had any affect on the outcomes of our test subjects. . The p-val is the percent likelihood of whether differences between variables are statistically significant. o It removes the subjectivity that a researcher may intrinsically carry. Apply the following guidelines in determining significance. . p-val less than or equal to 0.05 Reject the Null Hypothesis. . There is a significant difference between the data sets . p-value greater than 0.05 Accept the Null Hypothesis. . There is no significant difference between the data setWhat is the Alternate Hypothesis (based on your knowledge of Photosynthesis)? + You will be submitting this Null to Canvas later, so save it in a document. MNow, let's check if there is objectively a difference. We can use free software /s to accomplish this. QuickCalcs B will allow you to enter your data and reveal the Mean (denoted as Z), Standard Deviations (+5D) and Probability Values (P-val or just P=) with ease! For those of you who have already taken Statistics, this is a simple practice. For those of you who haven't, this software takes the complexities of Statistics out of your hands and simplifies everything! Metacognition - terminology o Whatis a Mean? o What is a Standard Deviation? Test the data for yourself! Copy and paste the data into the columns of the software to determine if your Null Hypothesis (Hg) will be Accepted or Rejected. Here is what your entry should look like: R .l | F B o Camiet G N e g et A B S 1. Select category 2. Chi calculator 3. Enter data 4, View results t test calculator A I test compares the means of two groups. For example, compare whether systolic blood pressure differs between a control and treated group, between men and women, or any other two groups. Don't confuse [ tesls with correlation and regression. The [ test compares one variable (perhaps blood pressure) between two groups. Use correlation and regression to see how two variables (perhaps blood pressure and heart rate) vary together. Also don't confuse t tests with ANOVA. The { tests (and related Based on these results, would you Accept or Reject the Null Hypothesis? Explain based on Statistics. You will also be submitting this to Canvas. Based on your observation of the Raw Data, you may have noticed something strange. If you didn't, please take a look again. That's right! There are two unusual data points, one in each of the columns. These are called Outliers. They are likely mistakes that have been recorded in the data table, therefore they create a large range in the Standard Deviation around the Mean. If you think about the measurements that were being recorded, it wouldn't make sense to have a 33 or 35 millimeter bubble of oxygen collected in a tiny test tube. Resubmit the Raw Data to QuickCalcs without the Outlier Data Points and click the Calculate Now button. Here is what your entry should look like: 1. Select category 2. Choose calculator 3. Enter data i, View results T test calculator A ttest compares the means of two groups. There are several types of two sample t tests and this calculator focuses an the three most common: unpaired, welch's, and paired tests. Directions for using the calculator are listed below, along with mare information about two sample t tests and help on which is appropriate for your analysis. MNOTE: This is not the same as a one sample t test; for that, you need this One sample t test calculator. 1. Choose data entry format 2. Choose a test Caution: Changing format will erase your data Help me choose Enter up 1o 50 rows @ Unpaired ! test @ Enter or paste up to 2000 rows Welch's unpaired t test (used rarely) Ddot COULD, . Explain based on Statistics. Based on these results, would you Accept or Reject the Alternate Hypothesis? . Explain based on the Biology. If you don't know anything about plants, look it up based on the variables presented in this experiment. Think about what variable the diameter of the bubble is correlated. Add this to your document for Submission to Canvas. Later in the semester, you will be using this same software to enter the data from other experiments. What am I submitting to Canvas? 1. The Null Hypothesis for this experiment and the Alternate Hypothesis. 2. Based on the 1st results, would you Accept or Reject the Null Hypothesis? Explain based on Statistics. 3. Based on the 2nd results, would you Accept or Reject the Null Hypothesis? Explain based on Statistics. Would we Accept or Reject the Alternate Hypothesis? Explain based on what you know about the Biology of Plants
Step by Step Solution
There are 3 Steps involved in it
Step: 1
Get Instant Access to Expert-Tailored Solutions
See step-by-step solutions with expert insights and AI powered tools for academic success
Step: 2
Step: 3
Ace Your Homework with AI
Get the answers you need in no time with our AI-driven, step-by-step assistance