Answered step by step
Verified Expert Solution
Question
1 Approved Answer
Using table 5, answer the questions using the excel template. Part B: Calculate Product Costs B1: Compute New Standard Product Costs a: D.C. does not
Using table 5, answer the questions using the excel template.
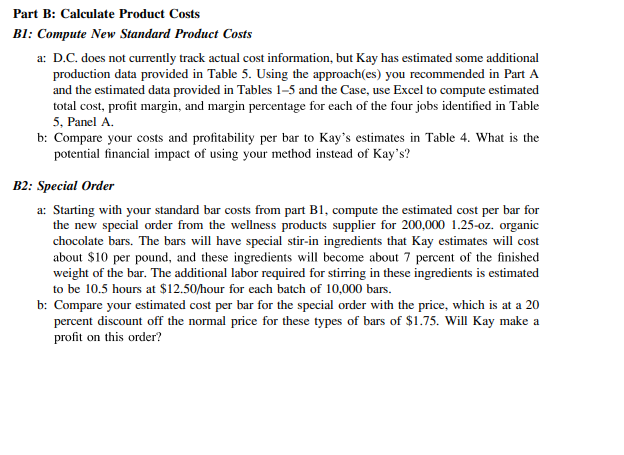
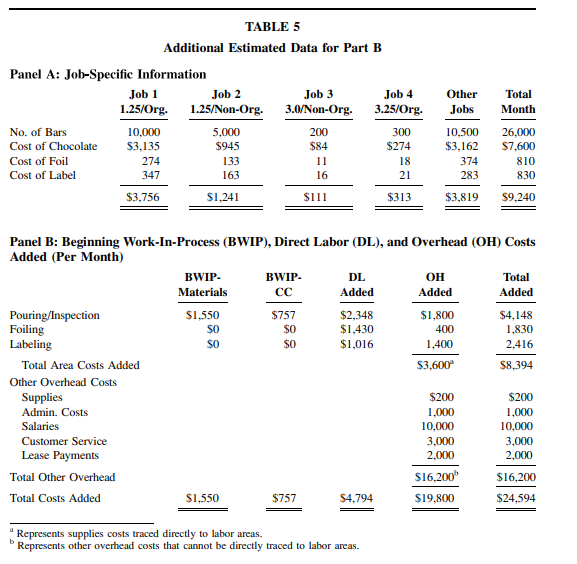
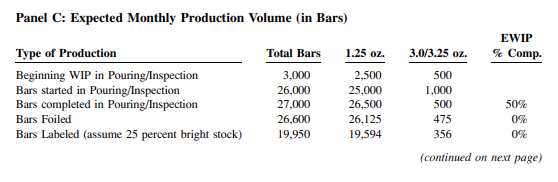
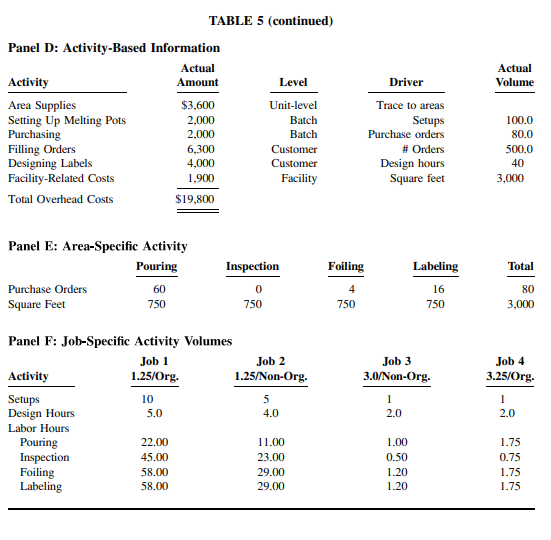
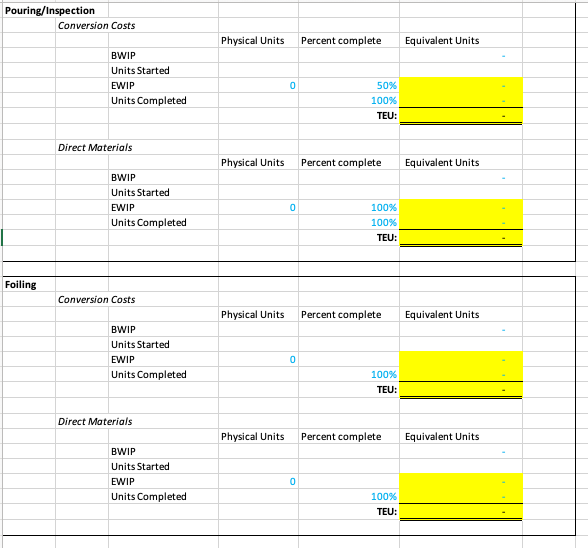
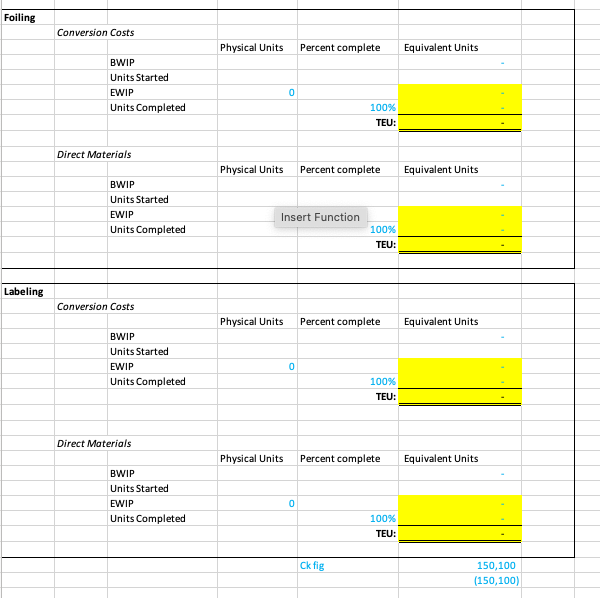
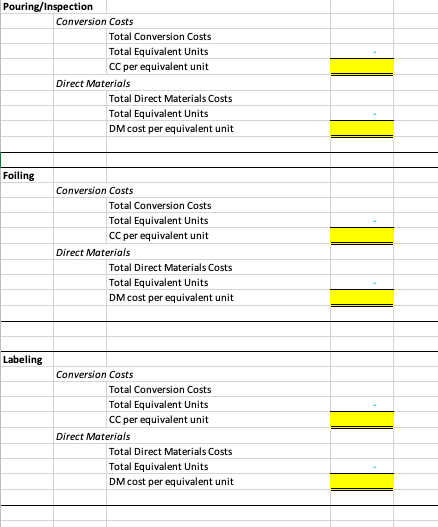
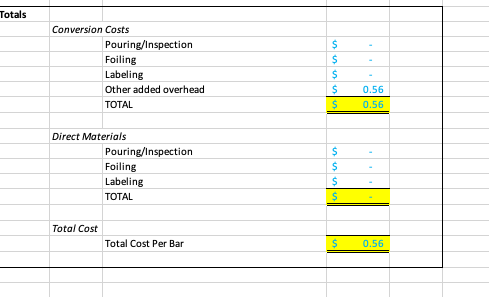
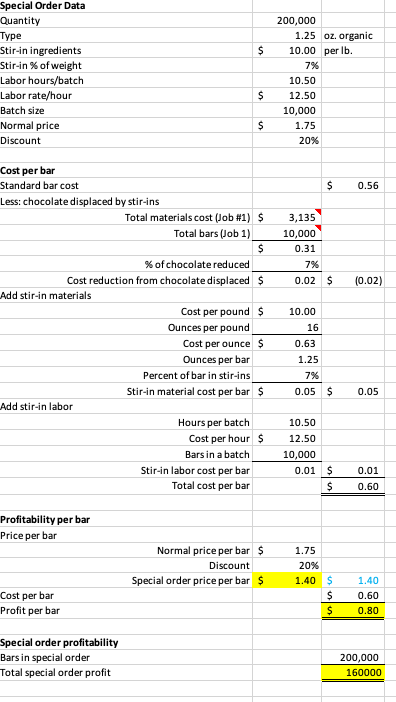
Part B: Calculate Product Costs B1: Compute New Standard Product Costs a: D.C. does not currently track actual cost information, but Kay has estimated some additional production data provided in Table 5. Using the approach(es) you recommended in Part A and the estimated data provided in Tables 1-5 and the Case, use Excel to compute estimated total cost, profit margin, and margin percentage for each of the four jobs identified in Table 5. Panel A. b: Compare your costs and profitability per bar to Kay's estimates in Table 4. What is the potential financial impact of using your method instead of Kay's? B2: Special Order a: Starting with your standard bar costs from part B1, compute the estimated cost per bar for the new special order from the wellness products supplier for 200,000 1.25-oz. organic chocolate bars. The bars will have special stir-in ingredients that Kay estimates will cost about $10 per pound, and these ingredients will become about 7 percent of the finished weight of the bar. The additional labor required for stirring in these ingredients is estimated to be 10.5 hours at $12.50/hour for each batch of 10,000 bars. b: Compare your estimated cost per bar for the special order with the price, which is at a 20 percent discount off the normal price for these types of bars of $1.75. Will Kay make a profit on this order? Total Month TABLE 5 Additional Estimated Data for Part B Panel A: Job-Specific Information Job 1 Job 2 Job 3 Job 4 1.25/Org. 1.25/Non-Org. 3.0/Non-Org. 3.25/Org. No. of Bars 10,000 5,000 200 300 Cost of Chocolate $3,135 $945 $84 $274 Cost of Foil 274 133 11 18 Cost of Label 347 163 16 21 $3,756 $1,241 $111 $313 Other Jobs 10,500 $3,162 374 283 26,000 $7,600 810 830 $3,819 $9.240 Panel B: Beginning Work-In-Process (BWIP), Direct Labor (DL), and Overhead (OH) Costs Added (Per Month) BWIP- BWIP DL OH Total Materials CC Added Added Added Pouring/Inspection $1,550 $757 $2,348 $1,800 $4,148 Foiling SO $0 $1,430 400 1,830 Labeling $0 $0 $1,016 1,400 2.416 Total Area Costs Added $3,600 58,394 Other Overhead Costs Supplies $200 $200 Admin. Costs 1.000 1,000 Salaries 10,000 10,000 Customer Service 3,000 3,000 Lease Payments 2,000 2.000 Total Other Overhead $16,200 $16,200 Total Costs Added $1,550 $757 $4,794 $19.800 $24,594 $ 757 $4,794 D Represents supplies costs traced directly to labor areas. Represents other overhead costs that cannot be directly traced to labor areas. Panel C: Expected Monthly Production Volume (in Bars) EWIP % Comp. Type of Production Beginning WIP in Pouring/Inspection Bars started in Pouring/Inspection Bars completed in Pouring/Inspection Bars Foiled Bars Labeled (assume 25 percent bright stock) Total Bars 3,000 26,000 27,000 26,600 19,950 1.25 oz. 2,500 25,000 26,500 26,125 19.594 3.0/3.25 oz. 500 1,000 500 475 356 50% 0% 0% (continued on next page) Actual Volume TABLE 5 (continued) Panel D: Activity-Based Information Actual Activity Amount Level Area Supplies $3,600 Unit-level Setting Up Melting Pots 2,000 Batch Purchasing 2,000 Batch Filling Orders 6,300 Customer Designing Labels 4,000 Customer Facility-Related Costs 1,900 Facility Total Overhead Costs $19,800 Driver Trace to areas Setups Purchase orders # Orders Design hours Square feet 100.0 80.0 500.0 40 3.000 Total Panel E: Area-Specific Activity Pouring Purchase Orders 60 Square Feet 750 Inspection 0 750 Foiling 4 750 Labeling 16 750 80 3,000 Job 3 3.0/Non-Org. Job 4 3.25/Org. Panel F: Job-Specific Activity Volumes Job 1 Job 2 Activity 1.25/Org. 1.25/Non-Org. Setups 10 5 Design Hours 5.0 4.0 Labor Hours Pouring 22.00 11.00 Inspection 45.00 23.00 Foiling 58.00 29.00 Labeling 58.00 29.00 1 2.0 1 2.0 1.00 0.50 1.20 1.20 1.75 0.75 1.75 1.75 Pouring/Inspection Conversion Costs Physical Units Percent complete Equivalent Units BWIP Units Started EWIP Units Completed 0 50% 100% TEU: Direct Materials Physical Units Percent complete Equivalent Units BWIP Units Started EWIP Units Completed 0 100% 100% TEU: Foiling Conversion Costs Physical Units Percent complete Equivalent Units BWIP Units Started EWIP Units Completed 0 100% TEU: Direct Materials Physical Units Percent complete Equivalent Units BWIP Units Started EWIP Units Completed 0 100% TEU: Foiling Conversion Costs Physical Units Percent complete Equivalent Units BWIP Units Started EWIP Units Completed 0 100% TEU: Direct Materials Physical Units Percent complete Equivalent Units BWIP Units Started EWIP Units Completed Insert Function 100% TEU: Labeling Conversion Costs Physical Units Percent complete Equivalent Units BWIP Units Started EWIP Units Completed 0 100% TEU: Direct Materials Physical Units Percent complete Equivalent Units BWIP Units Started EWIP Units Completed 0 100% TEU: Ck fig 150,100 (150,100) Pouring/Inspection Conversion Costs Total Conversion Costs Total Equivalent Units CC per equivalent unit Direct Materials Total Direct Materials Costs Total Equivalent Units DM cost per equivalent unit Foiling Conversion Costs Total Conversion Costs Total Equivalent Units CC per equivalent unit Direct Materials Total Direct Materials Costs Total Equivalent Units DM cost per equivalent unit Labeling Conversion Costs Total Conversion Costs Total Equivalent Units CC per equivalent unit Direct Materials Total Direct Materials Costs Total Equivalent Units DM cost per equivalent unit Totals Conversion Costs Pouring/Inspection Foiling Labeling Other added overhead TOTAL $ $ S $ $ 0.56 0.56 Direct Materials Pouring/Inspection Foiling Labeling TOTAL $ $ $ $ Total Cost Total Cost Per Bar $ 0.56 $ Special Order Data Quantity Type Stir-in ingredients Stir-in % of weight Labor hours/batch Labor rate/hour Batch size Normal price Discount 200,000 1.25 oz. organic 10.00 per Ib. 7% 10.50 12.50 10,000 1.75 20% $ $ $ 0.56 3,135 10,000 0.31 7% 0.02 $ (0.02) Cost per bar Standard bar cost Less: chocolate displaced by stir-ins Total materials cost (Job #1) $ Total bars (Job 1) $ % of chocolate reduced Cost reduction from chocolate displaced $ Add stir-in materials Cost per pound $ Ounces per pound Cost per ounce $ Ounces per bar Percent of bar in stir-ins Stir-in material cost per bar $ Add stir-in labor Hours per batch Cost per hour $ Bars in a batch Stir-in labor cost per bar Total cost per bar 10.00 16 0.63 1.25 7% 0.05 $ 0.05 10.50 12.50 10,000 0.01 $ $ 0.01 0.60 Profitability per bar Price per bar Normal price per bar $ Discount Special order price per bar $ 1.75 20% 1.40 $ $ $ Cost per bar Profit per bar 1.40 0.60 0.80 Special order profitability Bars in special order Total special order profit 200,000 160000 Part B: Calculate Product Costs B1: Compute New Standard Product Costs a: D.C. does not currently track actual cost information, but Kay has estimated some additional production data provided in Table 5. Using the approach(es) you recommended in Part A and the estimated data provided in Tables 1-5 and the Case, use Excel to compute estimated total cost, profit margin, and margin percentage for each of the four jobs identified in Table 5. Panel A. b: Compare your costs and profitability per bar to Kay's estimates in Table 4. What is the potential financial impact of using your method instead of Kay's? B2: Special Order a: Starting with your standard bar costs from part B1, compute the estimated cost per bar for the new special order from the wellness products supplier for 200,000 1.25-oz. organic chocolate bars. The bars will have special stir-in ingredients that Kay estimates will cost about $10 per pound, and these ingredients will become about 7 percent of the finished weight of the bar. The additional labor required for stirring in these ingredients is estimated to be 10.5 hours at $12.50/hour for each batch of 10,000 bars. b: Compare your estimated cost per bar for the special order with the price, which is at a 20 percent discount off the normal price for these types of bars of $1.75. Will Kay make a profit on this order? Total Month TABLE 5 Additional Estimated Data for Part B Panel A: Job-Specific Information Job 1 Job 2 Job 3 Job 4 1.25/Org. 1.25/Non-Org. 3.0/Non-Org. 3.25/Org. No. of Bars 10,000 5,000 200 300 Cost of Chocolate $3,135 $945 $84 $274 Cost of Foil 274 133 11 18 Cost of Label 347 163 16 21 $3,756 $1,241 $111 $313 Other Jobs 10,500 $3,162 374 283 26,000 $7,600 810 830 $3,819 $9.240 Panel B: Beginning Work-In-Process (BWIP), Direct Labor (DL), and Overhead (OH) Costs Added (Per Month) BWIP- BWIP DL OH Total Materials CC Added Added Added Pouring/Inspection $1,550 $757 $2,348 $1,800 $4,148 Foiling SO $0 $1,430 400 1,830 Labeling $0 $0 $1,016 1,400 2.416 Total Area Costs Added $3,600 58,394 Other Overhead Costs Supplies $200 $200 Admin. Costs 1.000 1,000 Salaries 10,000 10,000 Customer Service 3,000 3,000 Lease Payments 2,000 2.000 Total Other Overhead $16,200 $16,200 Total Costs Added $1,550 $757 $4,794 $19.800 $24,594 $ 757 $4,794 D Represents supplies costs traced directly to labor areas. Represents other overhead costs that cannot be directly traced to labor areas. Panel C: Expected Monthly Production Volume (in Bars) EWIP % Comp. Type of Production Beginning WIP in Pouring/Inspection Bars started in Pouring/Inspection Bars completed in Pouring/Inspection Bars Foiled Bars Labeled (assume 25 percent bright stock) Total Bars 3,000 26,000 27,000 26,600 19,950 1.25 oz. 2,500 25,000 26,500 26,125 19.594 3.0/3.25 oz. 500 1,000 500 475 356 50% 0% 0% (continued on next page) Actual Volume TABLE 5 (continued) Panel D: Activity-Based Information Actual Activity Amount Level Area Supplies $3,600 Unit-level Setting Up Melting Pots 2,000 Batch Purchasing 2,000 Batch Filling Orders 6,300 Customer Designing Labels 4,000 Customer Facility-Related Costs 1,900 Facility Total Overhead Costs $19,800 Driver Trace to areas Setups Purchase orders # Orders Design hours Square feet 100.0 80.0 500.0 40 3.000 Total Panel E: Area-Specific Activity Pouring Purchase Orders 60 Square Feet 750 Inspection 0 750 Foiling 4 750 Labeling 16 750 80 3,000 Job 3 3.0/Non-Org. Job 4 3.25/Org. Panel F: Job-Specific Activity Volumes Job 1 Job 2 Activity 1.25/Org. 1.25/Non-Org. Setups 10 5 Design Hours 5.0 4.0 Labor Hours Pouring 22.00 11.00 Inspection 45.00 23.00 Foiling 58.00 29.00 Labeling 58.00 29.00 1 2.0 1 2.0 1.00 0.50 1.20 1.20 1.75 0.75 1.75 1.75 Pouring/Inspection Conversion Costs Physical Units Percent complete Equivalent Units BWIP Units Started EWIP Units Completed 0 50% 100% TEU: Direct Materials Physical Units Percent complete Equivalent Units BWIP Units Started EWIP Units Completed 0 100% 100% TEU: Foiling Conversion Costs Physical Units Percent complete Equivalent Units BWIP Units Started EWIP Units Completed 0 100% TEU: Direct Materials Physical Units Percent complete Equivalent Units BWIP Units Started EWIP Units Completed 0 100% TEU: Foiling Conversion Costs Physical Units Percent complete Equivalent Units BWIP Units Started EWIP Units Completed 0 100% TEU: Direct Materials Physical Units Percent complete Equivalent Units BWIP Units Started EWIP Units Completed Insert Function 100% TEU: Labeling Conversion Costs Physical Units Percent complete Equivalent Units BWIP Units Started EWIP Units Completed 0 100% TEU: Direct Materials Physical Units Percent complete Equivalent Units BWIP Units Started EWIP Units Completed 0 100% TEU: Ck fig 150,100 (150,100) Pouring/Inspection Conversion Costs Total Conversion Costs Total Equivalent Units CC per equivalent unit Direct Materials Total Direct Materials Costs Total Equivalent Units DM cost per equivalent unit Foiling Conversion Costs Total Conversion Costs Total Equivalent Units CC per equivalent unit Direct Materials Total Direct Materials Costs Total Equivalent Units DM cost per equivalent unit Labeling Conversion Costs Total Conversion Costs Total Equivalent Units CC per equivalent unit Direct Materials Total Direct Materials Costs Total Equivalent Units DM cost per equivalent unit Totals Conversion Costs Pouring/Inspection Foiling Labeling Other added overhead TOTAL $ $ S $ $ 0.56 0.56 Direct Materials Pouring/Inspection Foiling Labeling TOTAL $ $ $ $ Total Cost Total Cost Per Bar $ 0.56 $ Special Order Data Quantity Type Stir-in ingredients Stir-in % of weight Labor hours/batch Labor rate/hour Batch size Normal price Discount 200,000 1.25 oz. organic 10.00 per Ib. 7% 10.50 12.50 10,000 1.75 20% $ $ $ 0.56 3,135 10,000 0.31 7% 0.02 $ (0.02) Cost per bar Standard bar cost Less: chocolate displaced by stir-ins Total materials cost (Job #1) $ Total bars (Job 1) $ % of chocolate reduced Cost reduction from chocolate displaced $ Add stir-in materials Cost per pound $ Ounces per pound Cost per ounce $ Ounces per bar Percent of bar in stir-ins Stir-in material cost per bar $ Add stir-in labor Hours per batch Cost per hour $ Bars in a batch Stir-in labor cost per bar Total cost per bar 10.00 16 0.63 1.25 7% 0.05 $ 0.05 10.50 12.50 10,000 0.01 $ $ 0.01 0.60 Profitability per bar Price per bar Normal price per bar $ Discount Special order price per bar $ 1.75 20% 1.40 $ $ $ Cost per bar Profit per bar 1.40 0.60 0.80 Special order profitability Bars in special order Total special order profit 200,000 160000
Step by Step Solution
There are 3 Steps involved in it
Step: 1

Get Instant Access to Expert-Tailored Solutions
See step-by-step solutions with expert insights and AI powered tools for academic success
Step: 2

Step: 3
Ace Your Homework with AI
Get the answers you need in no time with our AI-driven, step-by-step assistance
Get Started