Using Table 5.3 as your guide, what is your estimate of the expected annual HPR on the S&P 500 stock portfolio if the current risk-free interest rate is 5.9%? (Round your answer to 2 decimal places.)
Expected annual HPR %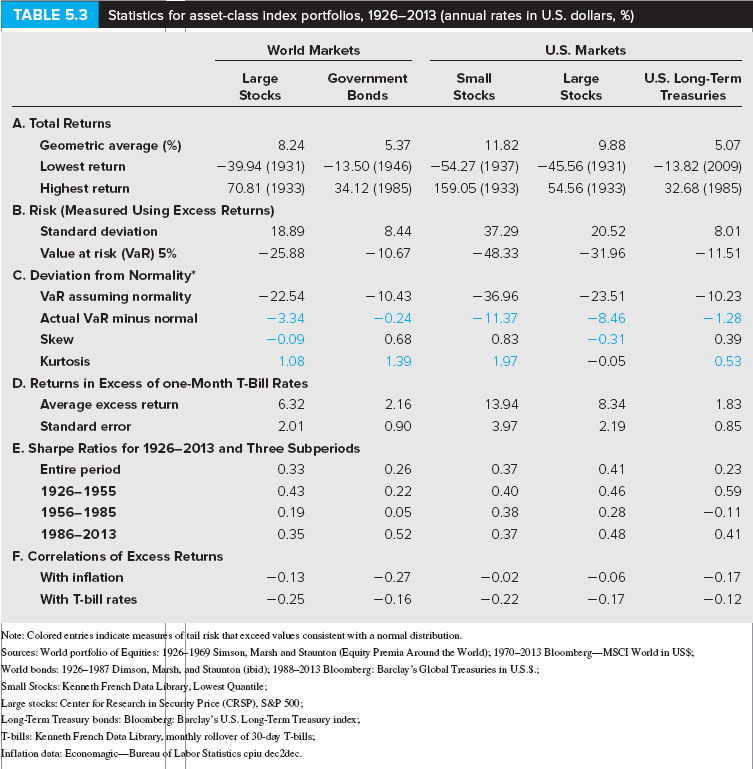
TABLE 5.3 Statistics for asset-class index portfolios, 1926-2013 (annual rates in U.S. dollars, %) World Markets U.S. Markets Government Bonds Small Stocks U.S. Long-Term Treasuries Stocks Stocks A. Total Returns Geometric average (%) Lowest return Highest return 5.07 -39.94 (1931) -13.50 (1946) -54.27 (1937) -45.56 (1931) -13.82 (2009) 70.81 (1933) 34.12 (1985) 159.05 (1933) 54.56 (1933) 32.68 (1985) 8.24 5.37 9.88 B. Risk (Measured Using Excess Returns) 37.29 48.33 Standard deviation 20.52 18.89 -25.88 Value at risk (VaR) 5% 10.67 C. Deviation from Normality -22.54 3.34 0.09 1.08 D. Returns in Excess of one-Month T-Bill Rates 6.32 2.01 VaR assuming normality Actual VaR minus normal Skew Kurtosis 10.43 -0.24 0.68 1.39 -23.51 8.46 0.31 -0.05 -36.96 11.37 10.23 0.39 0.53 1.97 Average excess return Standard error 2.16 0.90 8.34 2.19 3.97 E. Sharpe Ratios for 1926-2013 and Three Subperiods 0.23 Entire period 1926-1955 1956-1985 1986-2013 0.33 0.26 0.22 0.37 0.59 0.38 0.35 0.52 0.37 F. Correlations of Excess Returns 0.06 0.17 With inflation 0.27 With T-bill rates -0.25 -0.22 Colored entries indicate s of tail risk thatexceed vales consistent with a normal distribution. s: World portfolio of Equities: 1926-1969 Simson, Marsh and Staunton Equity Premia Around the World): 1970-2013 Bloomberg-MSCI World in USS. orld bonds: 1926-1987 Dimson, d Staunton (ibid), 1988-2013 Bloomberg: Barclay's Global Treasuries in US.S. l Stocks: Kenneth French Data L ibrary. Lowest Quantile stocks: Center for Research in Price (CRSP). S&P 500 Barclay's U.S. Long-Term Treasury index g-Term Treasury bonds: Bloomberg bills: Kenneth French Data Library nflation data: Ecnomagic-Bureau ly rollover of 30-day T-bills; r Statistics cpiu dec2dec. TABLE 5.3 Statistics for asset-class index portfolios, 1926-2013 (annual rates in U.S. dollars, %) World Markets U.S. Markets Government Bonds Small Stocks U.S. Long-Term Treasuries Stocks Stocks A. Total Returns Geometric average (%) Lowest return Highest return 5.07 -39.94 (1931) -13.50 (1946) -54.27 (1937) -45.56 (1931) -13.82 (2009) 70.81 (1933) 34.12 (1985) 159.05 (1933) 54.56 (1933) 32.68 (1985) 8.24 5.37 9.88 B. Risk (Measured Using Excess Returns) 37.29 48.33 Standard deviation 20.52 18.89 -25.88 Value at risk (VaR) 5% 10.67 C. Deviation from Normality -22.54 3.34 0.09 1.08 D. Returns in Excess of one-Month T-Bill Rates 6.32 2.01 VaR assuming normality Actual VaR minus normal Skew Kurtosis 10.43 -0.24 0.68 1.39 -23.51 8.46 0.31 -0.05 -36.96 11.37 10.23 0.39 0.53 1.97 Average excess return Standard error 2.16 0.90 8.34 2.19 3.97 E. Sharpe Ratios for 1926-2013 and Three Subperiods 0.23 Entire period 1926-1955 1956-1985 1986-2013 0.33 0.26 0.22 0.37 0.59 0.38 0.35 0.52 0.37 F. Correlations of Excess Returns 0.06 0.17 With inflation 0.27 With T-bill rates -0.25 -0.22 Colored entries indicate s of tail risk thatexceed vales consistent with a normal distribution. s: World portfolio of Equities: 1926-1969 Simson, Marsh and Staunton Equity Premia Around the World): 1970-2013 Bloomberg-MSCI World in USS. orld bonds: 1926-1987 Dimson, d Staunton (ibid), 1988-2013 Bloomberg: Barclay's Global Treasuries in US.S. l Stocks: Kenneth French Data L ibrary. Lowest Quantile stocks: Center for Research in Price (CRSP). S&P 500 Barclay's U.S. Long-Term Treasury index g-Term Treasury bonds: Bloomberg bills: Kenneth French Data Library nflation data: Ecnomagic-Bureau ly rollover of 30-day T-bills; r Statistics cpiu dec2dec