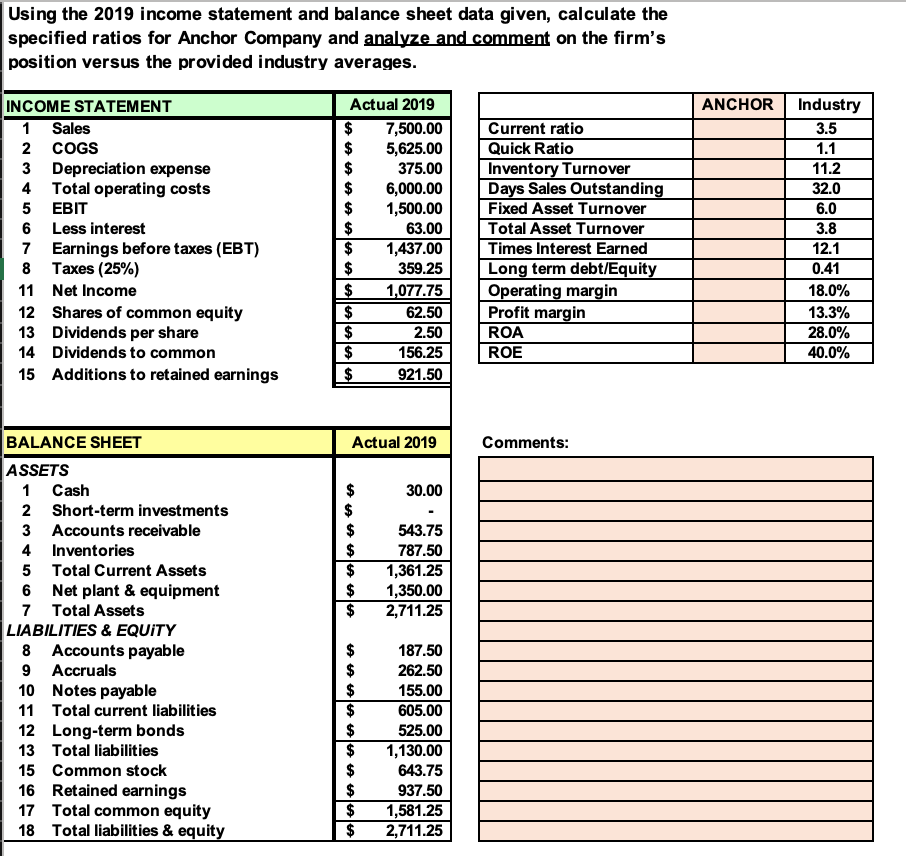
Using the 2019 income statement and balance sheet data given, calculate the specified ratios for Anchor Company and analyze and comment on the firm's position versus the provided industry averages. ANCHOR Industry 3.5 1.1 11.2 32.0 6.0 3.8 INCOME STATEMENT 1 Sales COGS Depreciation expense Total operating costs 5 EBIT Less interest 7 Earnings before taxes (EBT) 8 Taxes (25%) 11 Net Income 12 Shares of common equity 13 Dividends per share 14 Dividends to common 15 Additions to retained earnings Actual 2019 7,500.00 5,625.00 375.00 6,000.00 1,500.00 63.00 1,437.00 359.25 1,077.75 62.50 2.50 156.25 921.50 Current ratio Quick Ratio Inventory Turnover Days Sales Outstanding Fixed Asset Turnover Total Asset Turnover Times Interest Earned Long term debt/Equity Operating margin Profit margin ROA ROE 12.1 0.41 18.0% 13.3% 28.0% 40.0% Actual 2019 Comments: 30.00 A A 543.75 787.50 1,361.25 1,350.00 2,711.25 BALANCE SHEET ASSETS 1 Cash 2 Short-term investments 3 Accounts receivable 4 Inventories 5 Total Current Assets 6 Net plant & equipment 7 Total Assets LIABILITIES & EQUITY 8 Accounts payable 9 Accruals 10 Notes payable 11 Total current liabilities 12 Long-term bonds 13 Total liabilities 15 Common stock 16 Retained earnings 17 Total common equity 18 Total liabilities & equity 187.50 262.50 155.00 605.00 525.00 1,130.00 643.75 937.50 1,581.25 2,711.25 $ $ Using the 2019 income statement and balance sheet data given, calculate the specified ratios for Anchor Company and analyze and comment on the firm's position versus the provided industry averages. ANCHOR Industry 3.5 1.1 11.2 32.0 6.0 3.8 INCOME STATEMENT 1 Sales COGS Depreciation expense Total operating costs 5 EBIT Less interest 7 Earnings before taxes (EBT) 8 Taxes (25%) 11 Net Income 12 Shares of common equity 13 Dividends per share 14 Dividends to common 15 Additions to retained earnings Actual 2019 7,500.00 5,625.00 375.00 6,000.00 1,500.00 63.00 1,437.00 359.25 1,077.75 62.50 2.50 156.25 921.50 Current ratio Quick Ratio Inventory Turnover Days Sales Outstanding Fixed Asset Turnover Total Asset Turnover Times Interest Earned Long term debt/Equity Operating margin Profit margin ROA ROE 12.1 0.41 18.0% 13.3% 28.0% 40.0% Actual 2019 Comments: 30.00 A A 543.75 787.50 1,361.25 1,350.00 2,711.25 BALANCE SHEET ASSETS 1 Cash 2 Short-term investments 3 Accounts receivable 4 Inventories 5 Total Current Assets 6 Net plant & equipment 7 Total Assets LIABILITIES & EQUITY 8 Accounts payable 9 Accruals 10 Notes payable 11 Total current liabilities 12 Long-term bonds 13 Total liabilities 15 Common stock 16 Retained earnings 17 Total common equity 18 Total liabilities & equity 187.50 262.50 155.00 605.00 525.00 1,130.00 643.75 937.50 1,581.25 2,711.25 $ $


