Using the above information, please fill in ALL empty cells below:
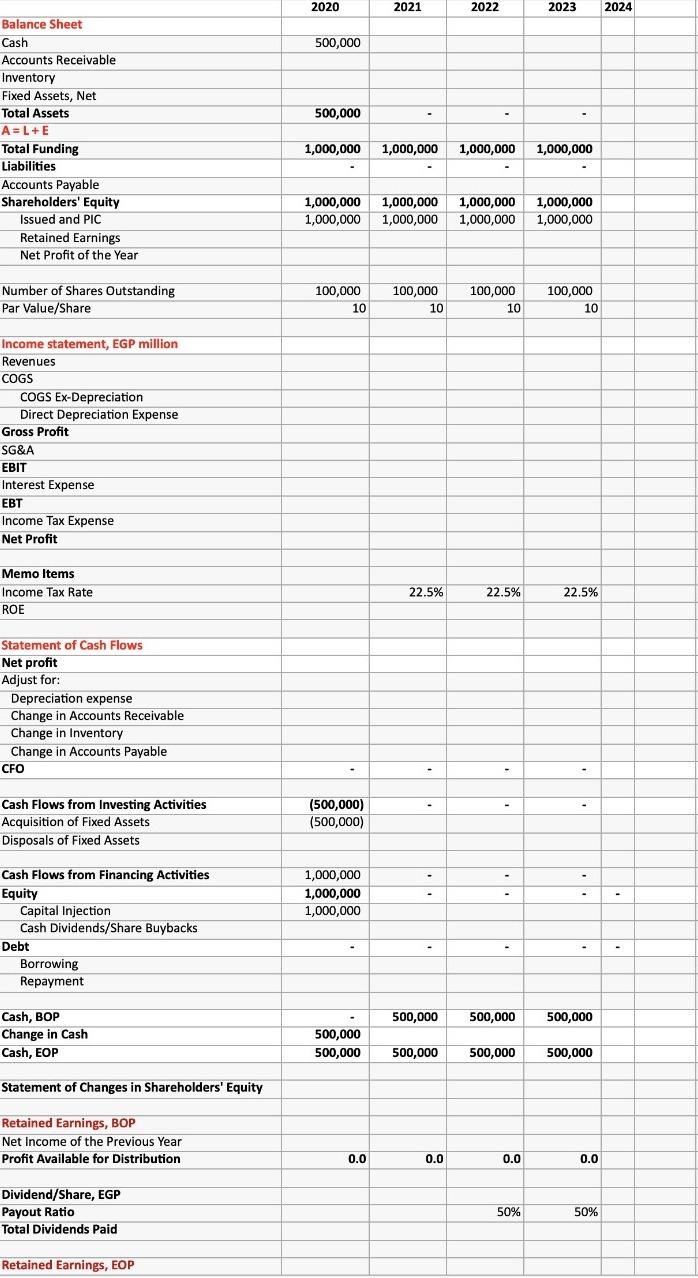
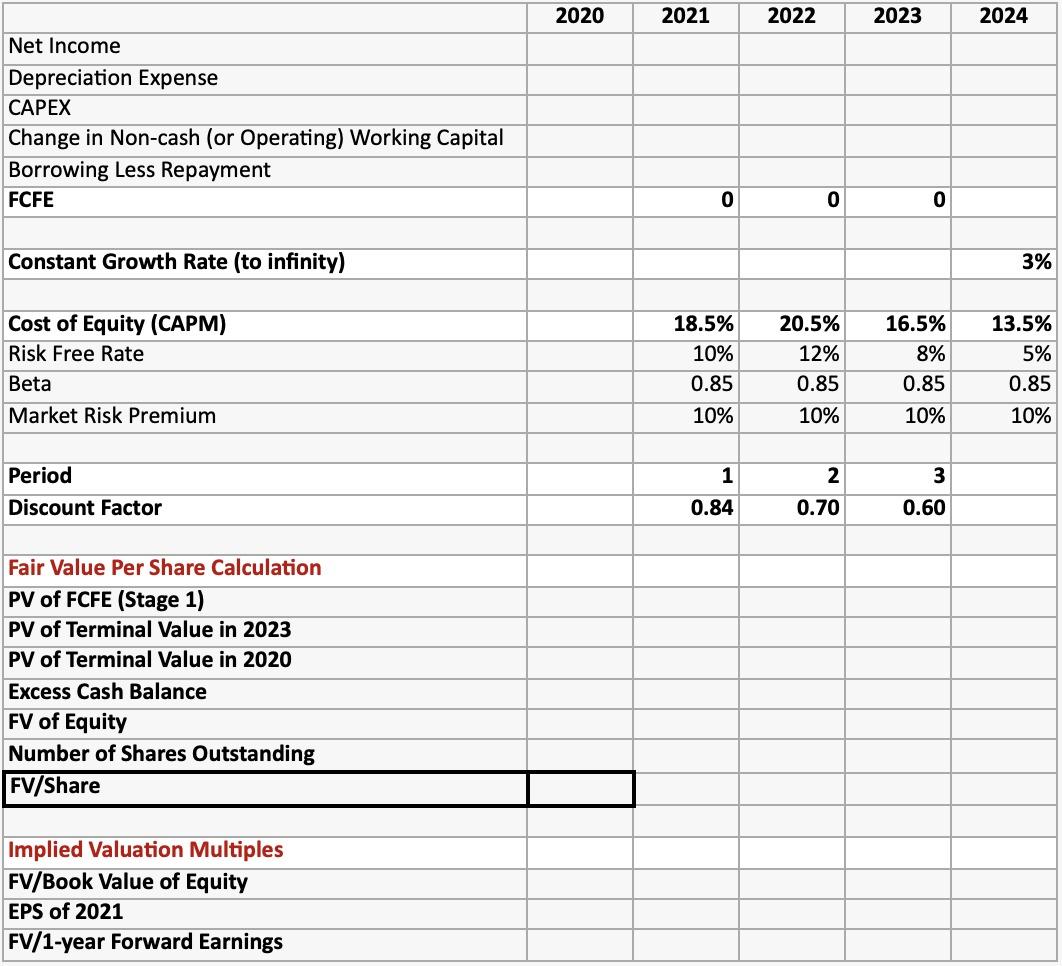
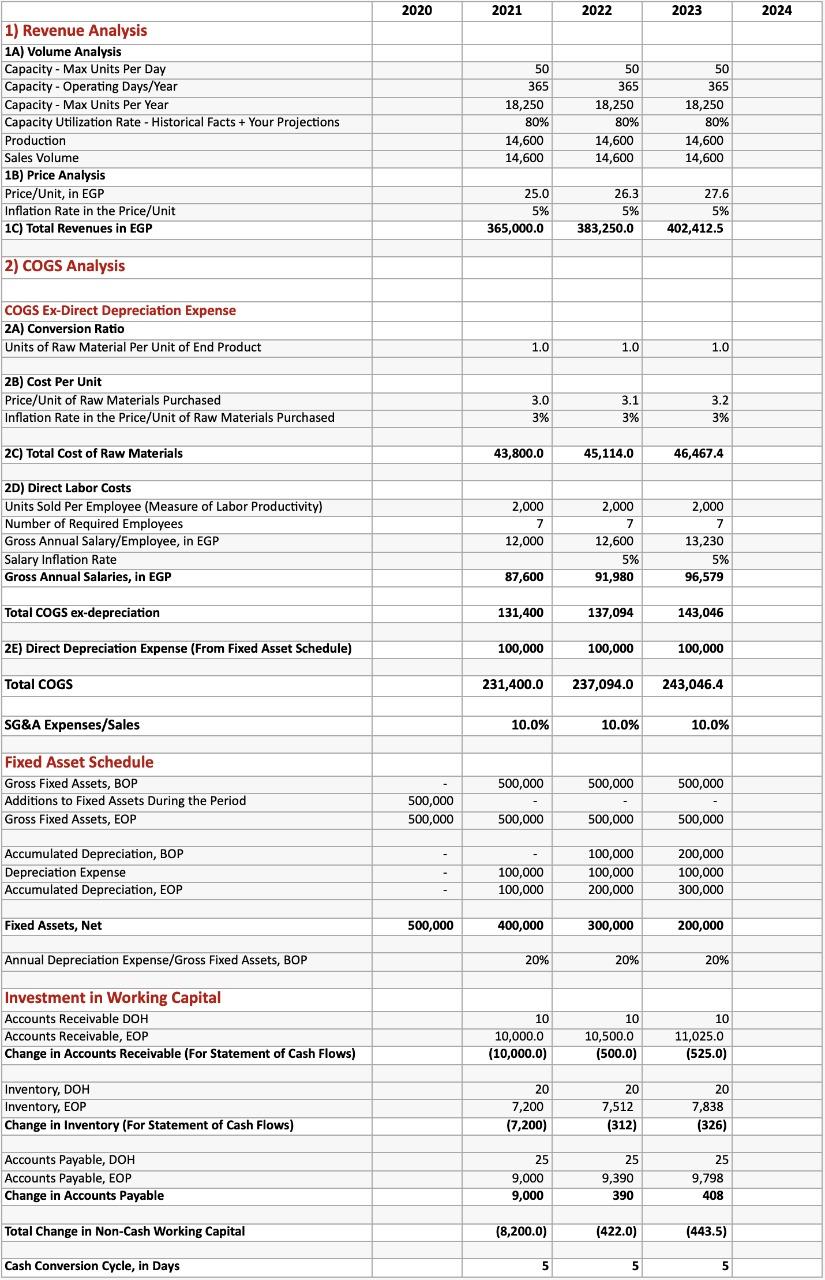
2020 2021 2022 2023 2024 1) Revenue Analysis 1A) Volume Analysis Capacity - Max Units Per Day Capacity - Operating Days/Year Capacity - Max Units Per Year Capacity Utilization Rate - Historical Facts + Your Projections Production Sales Volume 1B) Price Analysis Price/Unit, in EGP Inflation Rate in the Price/Unit 1C) Total Revenues in EGP 50 365 18,250 80% 14,600 14,600 50 365 18,250 80% 14,600 14,600 50 365 18,250 80% 14,600 14,600 25.0 5% 365,000.0 26.3 5% 383,250.0 27.6 5% 402,412.5 2) COGS Analysis COGS Ex-Direct Depreciation Expense 2A) Conversion Ratio Units of Raw Material Per Unit of End Product 1.0 1.0 1.0 2B) Cost Per Unit Price/Unit of Raw Materials Purchased Inflation Rate in the Price/Unit of Raw Materials Purchased 3.0 3% 3.1 3% 3.2 3% 2C) Total Cost of Raw Materials 43,800.0 45,114.0 46,467.4 2D) Direct Labor Costs Units Sold Per Employee (Measure of Labor Productivity) Number of Required Employees Gross Annual Salary/Employee, in EGP Salary Inflation Rate Gross Annual Salaries, in EGP 2,000 7 12,000 2,000 7 12,600 5% 91,980 2,000 7 13,230 5% 96,579 87,600 Total COGS ex-depreciation 131,400 137,094 143,046 2E) Direct Depreciation Expense (From Fixed Asset Schedule) 100,000 100,000 100,000 Total COGS 231,400.0 237,094.0 243,046.4 SG&A Expenses/Sales 10.0% 10.0% 10.0% Fixed Asset Schedule Gross Fixed Assets, BOP Additions to Fixed Assets During the Period Gross Fixed Assets, EOP 500,000 500,000 500,000 500,000 500,000 500,000 500,000 500,000 Accumulated Depreciation, BOP Depreciation Expense Accumulated Depreciation, EOP 100,000 100,000 100,000 100,000 200,000 200,000 100,000 300,000 Fixed Assets, Net 500,000 400,000 300,000 200,000 Annual Depreciation Expense/Gross Fixed Assets, BOP 20% 20% 20% Investment in Working Capital Accounts Receivable DOH Accounts Receivable, EOP Change in Accounts Receivable (For Statement of Cash Flows) 10 10,000.0 (10,000.0) 10 10,500.0 (500.0) 10 11,025.0 (525.0) Inventory, DOH Inventory, EOP Change in Inventory (For Statement of Cash Flows) 20 7,200 (7,200) 20 7,512 (312) 20 7,838 (326) Accounts Payable, DOH Accounts Payable, EOP Change in Accounts Payable 25 9,000 9,000 25 9,390 390 25 9,798 408 Total Change in Non-Cash Working Capital (8,200.0) (422.0) (443.5) Cash Conversion Cycle, in Days 5 5 5 2020 2021 2022 2023 2024 500,000 500,000 Balance Sheet Cash Accounts Receivable Inventory Fixed Assets, Net Total Assets A=L+E Total Funding Liabilities Accounts Payable Shareholders' Equity Issued and PIC Retained Earnings Net Profit of the Year 1,000,000 1,000,000 1,000,000 1,000,000 1,000,000 1,000,000 1,000,000 1,000,000 1,000,000 1,000,000 1,000,000 1,000,000 Number of Shares Outstanding Par Value/Share 100,000 10 100,000 10 100,000 10 100,000 10 Income statement, EGP million Revenues COGS COGS Ex-Depreciation Direct Depreciation Expense Gross Profit SG&A EBIT Interest Expense EBT Income Tax Expense Net Profit Memo Items Income Tax Rate ROE 22.5% 22.5% 22.5% Statement of Cash Flows Net profit Adjust for: Depreciation expense Change in Accounts Receivable Change in Inventory Change in Accounts Payable CFO - - Cash Flows from Investing Activities Acquisition of Fixed Assets Disposals of Fixed Assets (500,000) (500,000) 1,000,000 1,000,000 1,000,000 - Cash Flows from Financing Activities Equity Capital Injection Cash Dividends/Share Buybacks Debt Borrowing Repayment - 500,000 500,000 500,000 Cash, BOP Change in Cash Cash, EOP 500,000 500,000 500,000 500,000 500,000 Statement of Changes in Shareholders' Equity Retained Earnings, BOP Net Income of the Previous Year Profit Available for Distribution 0.0 0.0 0.0 0.0 Dividend/Share, EGP Payout Ratio Total Dividends Paid 50% 50% Retained Earnings, EOP 2020 2021 2022 2023 2024 Net Income Depreciation Expense CAPEX Change in Non-cash (or Operating) Working Capital Borrowing Less Repayment FCFE 0 0 0 Constant Growth Rate (to infinity) 3% Cost of Equity (CAPM) Risk Free Rate Beta Market Risk Premium 18.5% 10% 0.85 10% 20.5% 12% 0.85 10% 16.5% 8% 0.85 10% 13.5% 5% 0.85 10% 1 3 Period Discount Factor 2 0.70 0.84 0.60 Fair Value Per Share Calculation PV of FCFE (Stage 1) PV of Terminal value in 2023 PV of Terminal value in 2020 Excess Cash Balance FV of Equity Number of Shares Outstanding FV/Share Implied Valuation Multiples FV/Book Value of Equity EPS of 2021 FV/1-year Forward Earnings 2020 2021 2022 2023 2024 1) Revenue Analysis 1A) Volume Analysis Capacity - Max Units Per Day Capacity - Operating Days/Year Capacity - Max Units Per Year Capacity Utilization Rate - Historical Facts + Your Projections Production Sales Volume 1B) Price Analysis Price/Unit, in EGP Inflation Rate in the Price/Unit 1C) Total Revenues in EGP 50 365 18,250 80% 14,600 14,600 50 365 18,250 80% 14,600 14,600 50 365 18,250 80% 14,600 14,600 25.0 5% 365,000.0 26.3 5% 383,250.0 27.6 5% 402,412.5 2) COGS Analysis COGS Ex-Direct Depreciation Expense 2A) Conversion Ratio Units of Raw Material Per Unit of End Product 1.0 1.0 1.0 2B) Cost Per Unit Price/Unit of Raw Materials Purchased Inflation Rate in the Price/Unit of Raw Materials Purchased 3.0 3% 3.1 3% 3.2 3% 2C) Total Cost of Raw Materials 43,800.0 45,114.0 46,467.4 2D) Direct Labor Costs Units Sold Per Employee (Measure of Labor Productivity) Number of Required Employees Gross Annual Salary/Employee, in EGP Salary Inflation Rate Gross Annual Salaries, in EGP 2,000 7 12,000 2,000 7 12,600 5% 91,980 2,000 7 13,230 5% 96,579 87,600 Total COGS ex-depreciation 131,400 137,094 143,046 2E) Direct Depreciation Expense (From Fixed Asset Schedule) 100,000 100,000 100,000 Total COGS 231,400.0 237,094.0 243,046.4 SG&A Expenses/Sales 10.0% 10.0% 10.0% Fixed Asset Schedule Gross Fixed Assets, BOP Additions to Fixed Assets During the Period Gross Fixed Assets, EOP 500,000 500,000 500,000 500,000 500,000 500,000 500,000 500,000 Accumulated Depreciation, BOP Depreciation Expense Accumulated Depreciation, EOP 100,000 100,000 100,000 100,000 200,000 200,000 100,000 300,000 Fixed Assets, Net 500,000 400,000 300,000 200,000 Annual Depreciation Expense/Gross Fixed Assets, BOP 20% 20% 20% Investment in Working Capital Accounts Receivable DOH Accounts Receivable, EOP Change in Accounts Receivable (For Statement of Cash Flows) 10 10,000.0 (10,000.0) 10 10,500.0 (500.0) 10 11,025.0 (525.0) Inventory, DOH Inventory, EOP Change in Inventory (For Statement of Cash Flows) 20 7,200 (7,200) 20 7,512 (312) 20 7,838 (326) Accounts Payable, DOH Accounts Payable, EOP Change in Accounts Payable 25 9,000 9,000 25 9,390 390 25 9,798 408 Total Change in Non-Cash Working Capital (8,200.0) (422.0) (443.5) Cash Conversion Cycle, in Days 5 5 5 2020 2021 2022 2023 2024 500,000 500,000 Balance Sheet Cash Accounts Receivable Inventory Fixed Assets, Net Total Assets A=L+E Total Funding Liabilities Accounts Payable Shareholders' Equity Issued and PIC Retained Earnings Net Profit of the Year 1,000,000 1,000,000 1,000,000 1,000,000 1,000,000 1,000,000 1,000,000 1,000,000 1,000,000 1,000,000 1,000,000 1,000,000 Number of Shares Outstanding Par Value/Share 100,000 10 100,000 10 100,000 10 100,000 10 Income statement, EGP million Revenues COGS COGS Ex-Depreciation Direct Depreciation Expense Gross Profit SG&A EBIT Interest Expense EBT Income Tax Expense Net Profit Memo Items Income Tax Rate ROE 22.5% 22.5% 22.5% Statement of Cash Flows Net profit Adjust for: Depreciation expense Change in Accounts Receivable Change in Inventory Change in Accounts Payable CFO - - Cash Flows from Investing Activities Acquisition of Fixed Assets Disposals of Fixed Assets (500,000) (500,000) 1,000,000 1,000,000 1,000,000 - Cash Flows from Financing Activities Equity Capital Injection Cash Dividends/Share Buybacks Debt Borrowing Repayment - 500,000 500,000 500,000 Cash, BOP Change in Cash Cash, EOP 500,000 500,000 500,000 500,000 500,000 Statement of Changes in Shareholders' Equity Retained Earnings, BOP Net Income of the Previous Year Profit Available for Distribution 0.0 0.0 0.0 0.0 Dividend/Share, EGP Payout Ratio Total Dividends Paid 50% 50% Retained Earnings, EOP 2020 2021 2022 2023 2024 Net Income Depreciation Expense CAPEX Change in Non-cash (or Operating) Working Capital Borrowing Less Repayment FCFE 0 0 0 Constant Growth Rate (to infinity) 3% Cost of Equity (CAPM) Risk Free Rate Beta Market Risk Premium 18.5% 10% 0.85 10% 20.5% 12% 0.85 10% 16.5% 8% 0.85 10% 13.5% 5% 0.85 10% 1 3 Period Discount Factor 2 0.70 0.84 0.60 Fair Value Per Share Calculation PV of FCFE (Stage 1) PV of Terminal value in 2023 PV of Terminal value in 2020 Excess Cash Balance FV of Equity Number of Shares Outstanding FV/Share Implied Valuation Multiples FV/Book Value of Equity EPS of 2021 FV/1-year Forward Earnings