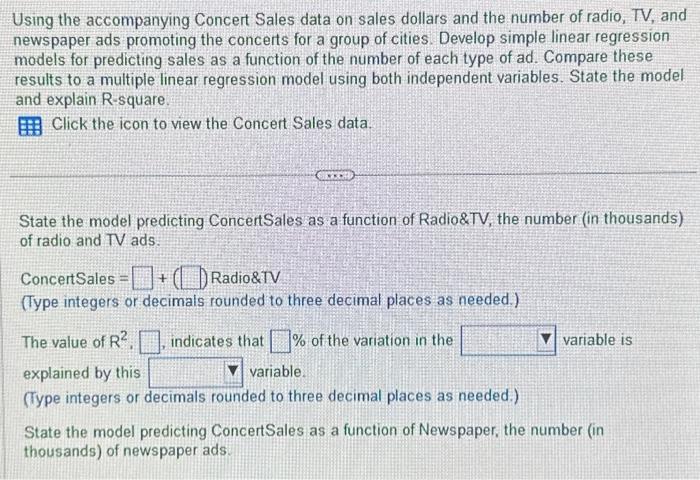
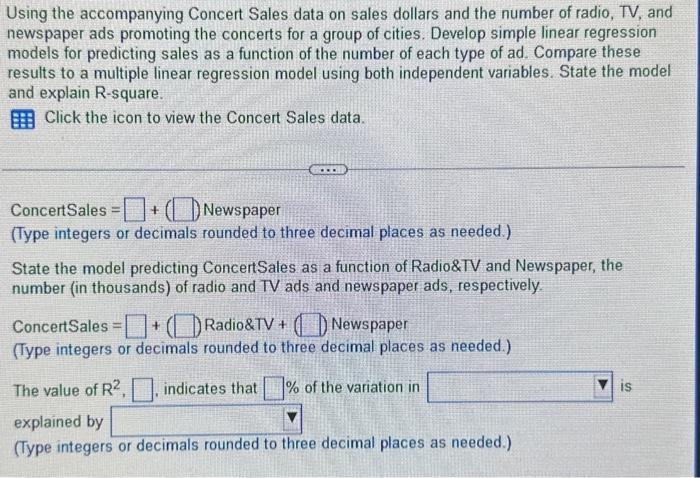
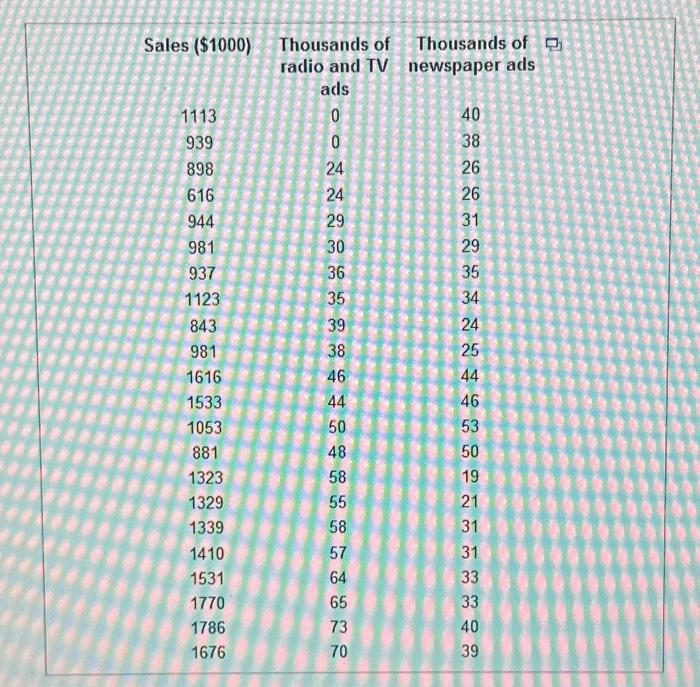
Using the accompanying Concert Sales data on sales dollars and the number of radio, TV, and newspaper ads promoting the concerts for a group of cities. Develop simple linear regression models for predicting sales as a function of the number of each type of ad. Compare these results to a multiple linear regression model using both independent variables. State the model and explain R-square. Click the icon to view the Concert Sales data. State the model predicting ConcertSales as a function of Radio\&TV, the number (in thousands) of radio and TV ads. ConcertSales =+1 Radio\&TV (Type integers or decimals rounded to three decimal places as needed.) The value of R2, indicates that % of the variation in the variable is explained by this (Type integers or decimals rounded to three decimal places as needed.) State the model predicting ConcertSales as a function of Newspaper, the number (in thousands) of newspaper ads. Using the accompanying Concert Sales data on sales dollars and the number of radio, TV, and newspaper ads promoting the concerts for a group of cities. Develop simple linear regression models for predicting sales as a function of the number of each type of ad. Compare these results to a multiple linear regression model using both independent variables. State the model and explain R-square. Click the icon to view the Concert Sales data. ConcertSales =+( Newspaper (Type integers or decimals rounded to three decimal places as needed.) State the model predicting ConcertSales as a function of Radio\&TV and Newspaper, the number (in thousands) of radio and TV ads and newspaper ads, respectively. ConcertSales =+( Radio\&TV + Newspaper (Type integers or decimals rounded to three decimal places as needed.) The value of R2, indicates that % of the variation in is explained by (Type integers or decimals rounded to three decimal places as needed.) Sales ($1000) Thousands of Thousands of radio and TV newspaper ads ads \begin{tabular}{ccc} 1113 & 0 & 40 \\ 939 & 0 & 38 \\ 898 & 24 & 26 \\ 616 & 24 & 26 \\ 944 & 29 & 31 \\ 981 & 30 & 29 \\ 937 & 36 & 35 \\ 1123 & 35 & 34 \\ 843 & 39 & 24 \\ 981 & 38 & 25 \\ 1616 & 46 & 44 \\ 1533 & 44 & 46 \\ 1053 & 50 & 53 \\ 881 & 48 & 50 \\ 1323 & 58 & 19 \\ 1329 & 55 & 21 \\ 1339 & 58 & 31 \\ 1410 & 57 & 31 \\ 1531 & 64 & 33 \\ 1770 & 65 & 33 \\ 1786 & 73 & 40 \\ 1676 & 70 & 39 \end{tabular}


