Question
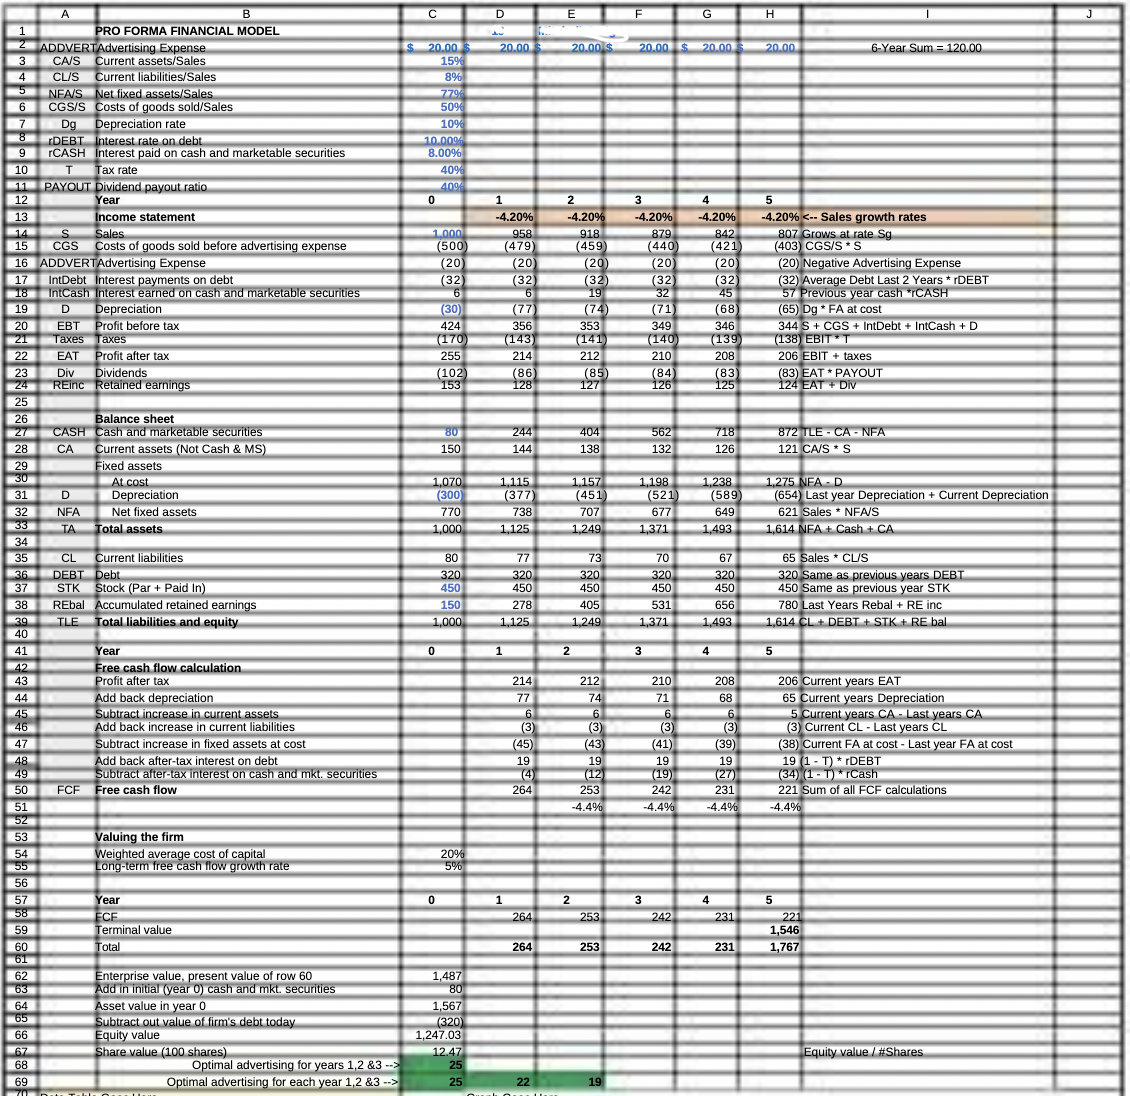
Using the assignment instructions and the spreadsheet below, how should the formulas for cells D2:F2 be written? I know how to complete the data table
Using the assignment instructions and the spreadsheet below, how should the formulas for cells D2:F2 be written? I know how to complete the data table but I am unable to figure out what formula connects the advertising budgets in cells D2:F2 to the equity valuation in cell C66.
Instructions: Build a data table and graph to show what happens to the equity value for different
advertising budgets in years 1-3 if the same amount is spent on advertising in each of
those three years. Use the shaded regions starting in A69 with advertising amounts from
$0 to $30 in $1 increments. You will need to alter cells D2:F2 to complete the analysis. The company is unable to spend more than $100 in any given year on advertising.
Spreadsheet Given:

1 2 ADDVERTAdvertising Expense 3 CA/S Current assets/Sales 4 CL/S Current liabilities/Sales 6 7 8 9 10 10 5NFA/S CGS/S Dg Depreciation rate DEBT Interest rate on debt rCASH Interest paid on cash and marketable securities 11 12 12 13 14 15 16 17 18 19 23 24 25 26 27 28 29 30 31 32 33 34 35 36 37 38 39 40 41 20 21 22 EAT Profit after tax 42 43 44 45 46 47 48 49 50 51 52 53 54 55 56 57 58 59 A 60 61 62 63 64 65 66 67 68 B PRO FORMA FINANCIAL MODEL Net fixed assets/Sales Costs of goods sold/Sales T Tax rate PAYOUT Dividend payout ratio Year Income statement S Sales CGS Costs of goods sold before advertising expense ADDVERTAdvertising Expense IntDebt Interest payments on debt IntCash Interest earned on cash and marketable securities D Depreciation EBT Profit before tax Taxes Taxes CASH CA Div Dividends REinc Retained earnings D NFA Balance sheet Cash and marketable securities Current assets (Not Cash & MS) Fixed assets At cost Depreciation Net fixed assets Total assets Current liabilities CL DEBT Debt STK Stock (Par + Paid In) REbal Accumulated retained earnings TLE Total liabilities and equity Year Free cash flow calculation. Profit after tax Add back depreciation Subtract increase in current assets Add back increase in current liabilities Subtract increase in fixed assets at cost Add back after-tax interest on debt Subtract after-tax interest on cash and mkt. securities FCF Free cash flow Valuing the firm Weighted average cost of capital Long-term free cash flow growth rate Year ECF Terminal value Total Enterprise value, present value of row 60 Add in initial (year 0) cash and mkt. securities Asset value in year 0 Subtract out value of firm's debt today Equity value Share value (100 shares) 69 70 Du Table Qu Optimal advertising for years 1,2 &3 --> Optimal advertising for each year 1,2 &3 --> C $ 20.00 15% 8% 77% 50% 10% 10.00% 8.00% 40% 40% 0 1.000 (500 $ 0 (20) (32) 6 0 (30) 424 (170 255 (102 153 80 150 1.070 (300) 770 1.000 80 320 450 150 1,000 20% 5% 1,487 80 1,567 (320) 1,247.03 12.47 25 25 D 20.00 $ 1 -4.20% 958 (479) (20) (32) 6 (77) 356 (143) 214 (86) 128 1.115 (377) 738 1 244 144 1,125 1 1.125 77 320 450 278 214 77 6 (3) (45) 19 (4) 264 264 264 22 E 2 -4.20% 918 (459) 2 20.00 $ 2 (20) (32) 19 (74) 353 (141 212 (85) 127 404 138 1.157 (451) 707 1,249 73 320 450 405 1,249 212 74 6 (3) (43) 19 (12) 253 -4.4% 253 253 19 F 20.00 $ 20.00 3 -4.20% 879 (440) (20) (32) 32 (71) 349 (140) 210 3 (84) 126 1,198 3 562 132 (521 677 1,371 1,371 70 320 450 531 210 71 6 20 (3) (41) 19 (19) 242 -4.4% 242 G 242 4 -4.20% 842 (421 (20) (32) 45 (68) 346 (139 208 4 (83) 125 1,238 718 126 (589) 649 1,493 67 320 450 656 1,493 4 208 68 6 70 (3) (39) 19 (27) 231 -4.4% 231 231 H 20.00 5 -4.20%
Step by Step Solution
There are 3 Steps involved in it
Step: 1
To connect the advertising budgets in cells D2F2 to the equity valuation in cell C66 we need to calc...
Get Instant Access to Expert-Tailored Solutions
See step-by-step solutions with expert insights and AI powered tools for academic success
Step: 2

Step: 3

Ace Your Homework with AI
Get the answers you need in no time with our AI-driven, step-by-step assistance
Get Started


