

Question
. Using the Black-Scholes pricing function in Excel, compute an option value for each strike price and maturity date in case Exhibit 2. For simplicity,
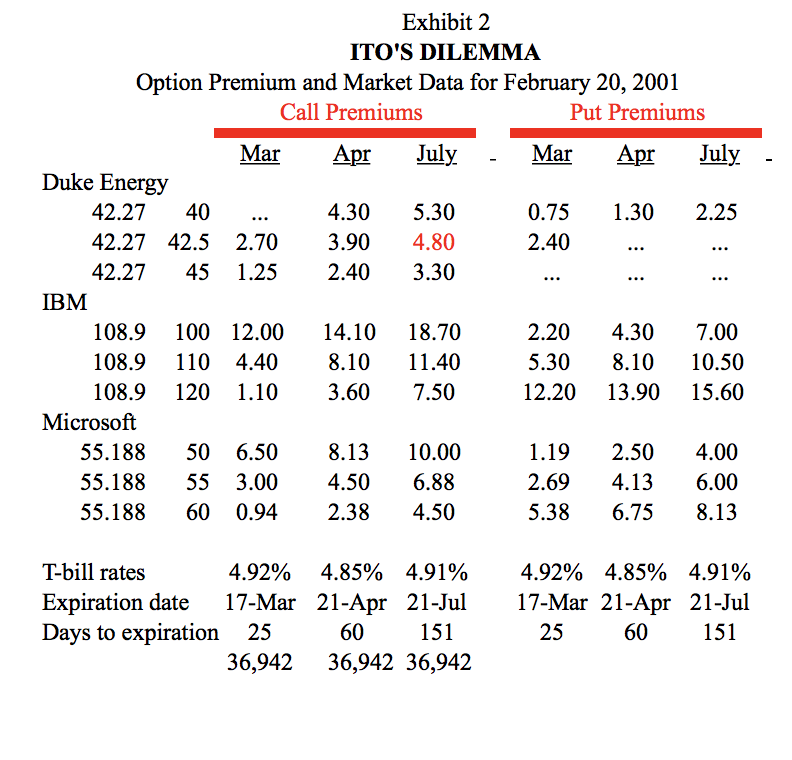 . Using the Black-Scholes pricing function in Excel, compute an option value for each strike price and maturity date in case Exhibit 2. For simplicity, assume zero dividend yield. Also, use Louise Itos volatility estimates, provided in case Exhibit 1.
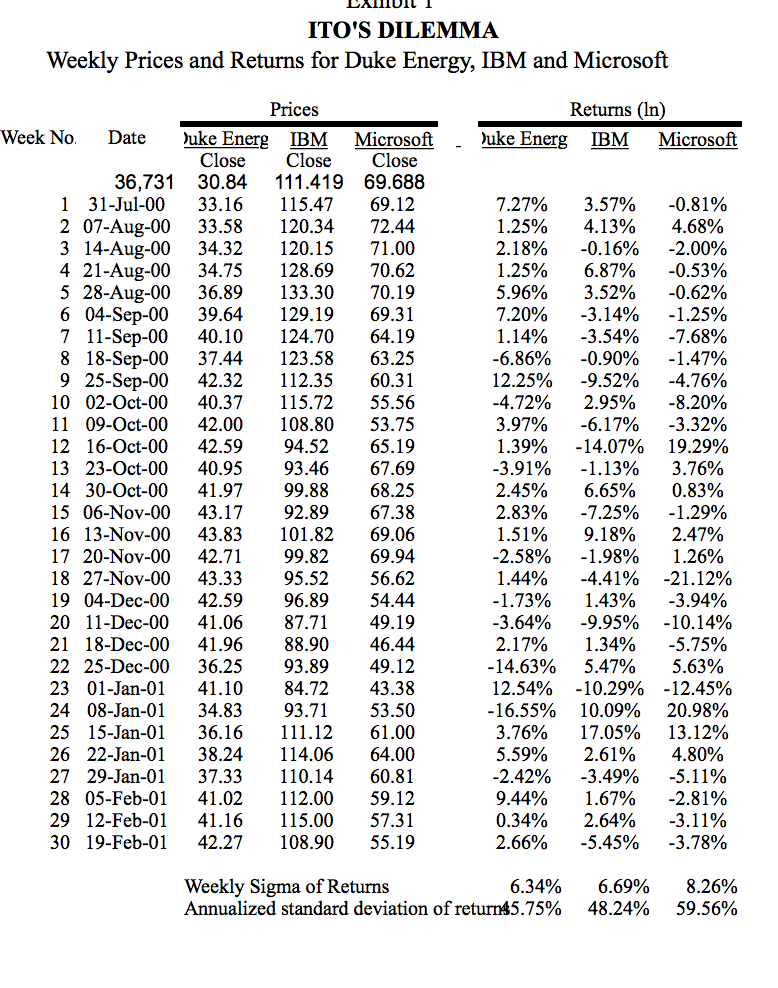
Step by Step Solution
There are 3 Steps involved in it
Step: 1

Get Instant Access to Expert-Tailored Solutions
See step-by-step solutions with expert insights and AI powered tools for academic success
Step: 2

Step: 3
Ace Your Homework with AI
Get the answers you need in no time with our AI-driven, step-by-step assistance
Get Started
Common Sense Business Principles For Profitable Leadership
Authors: Theodore Roosevelt Malloch , Whitney MacMillan
1st Edition
151072981X,1510729828