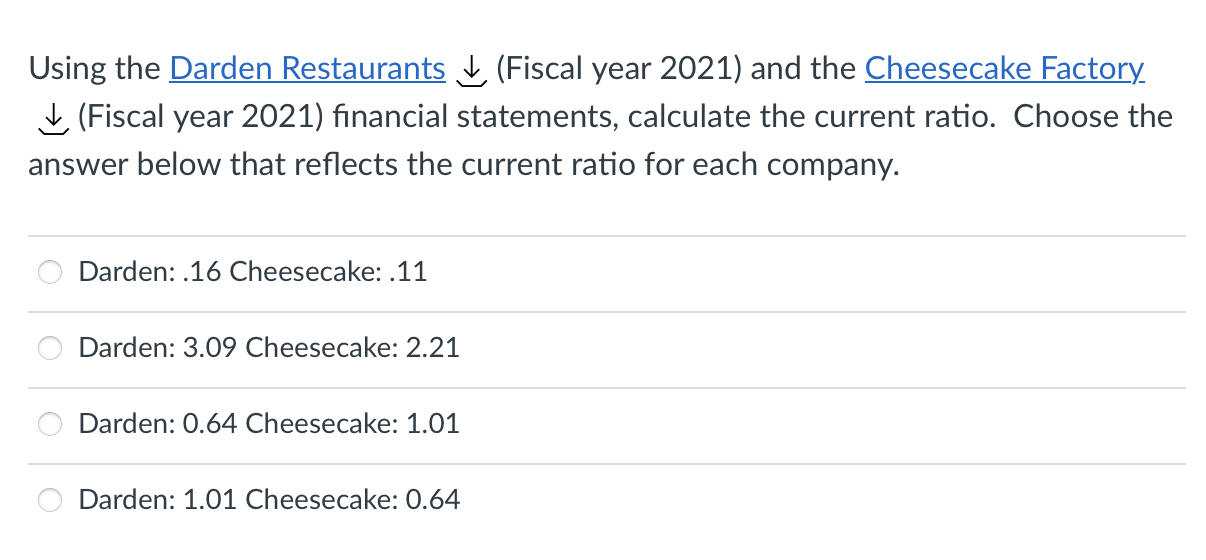
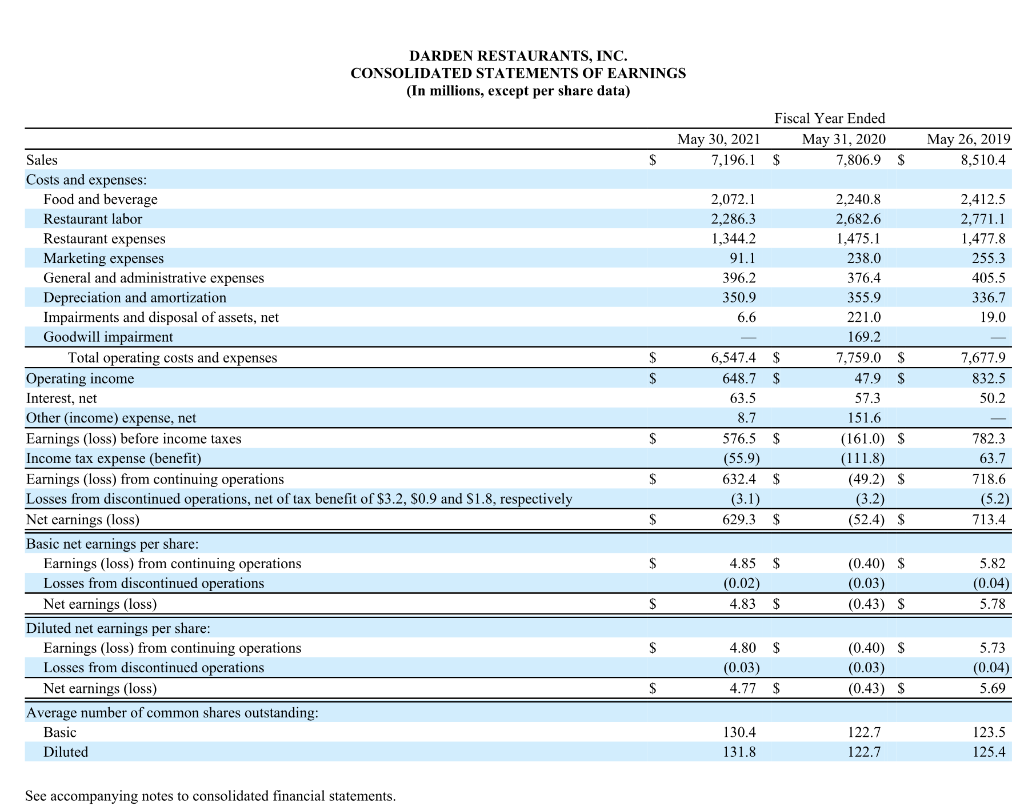
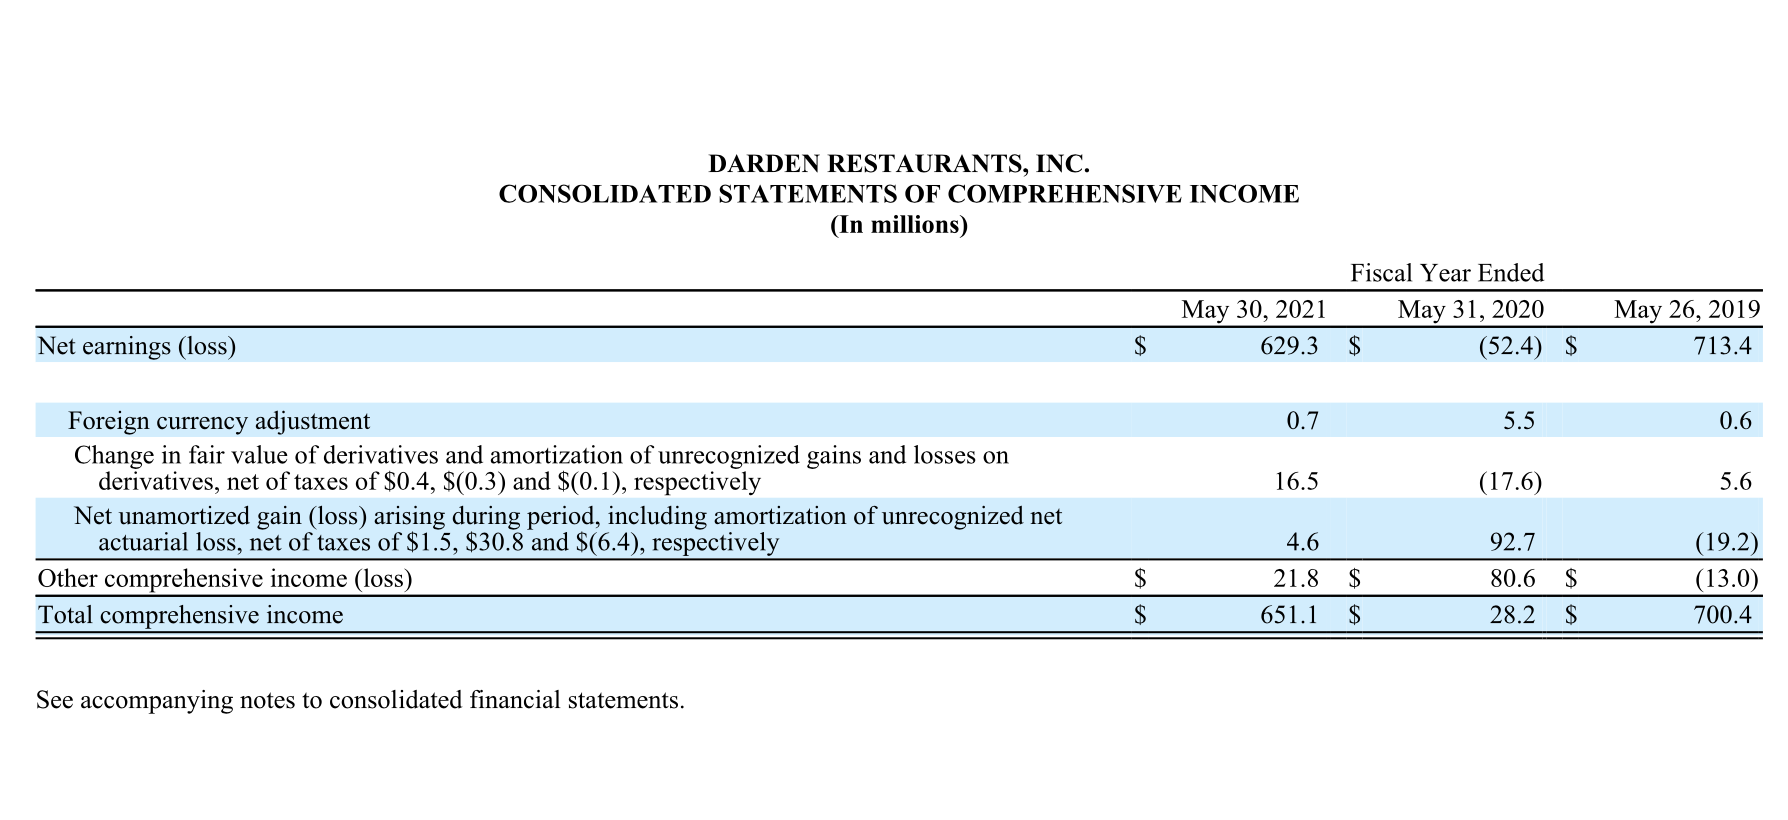
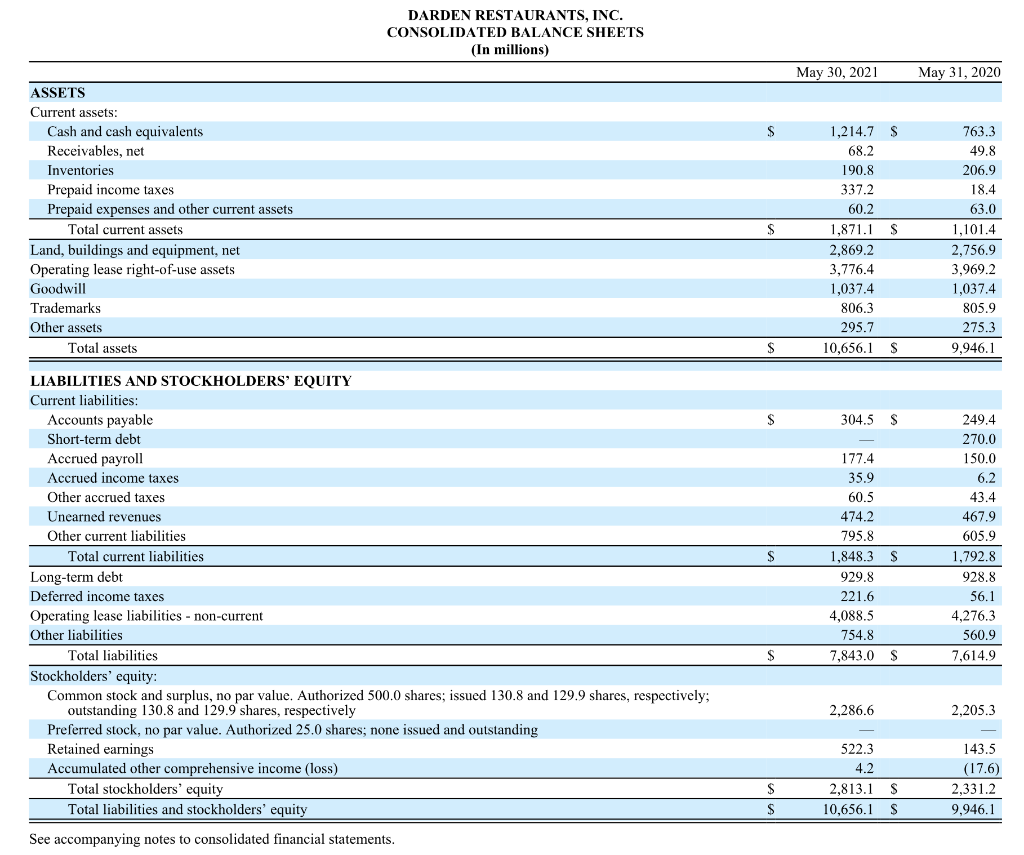
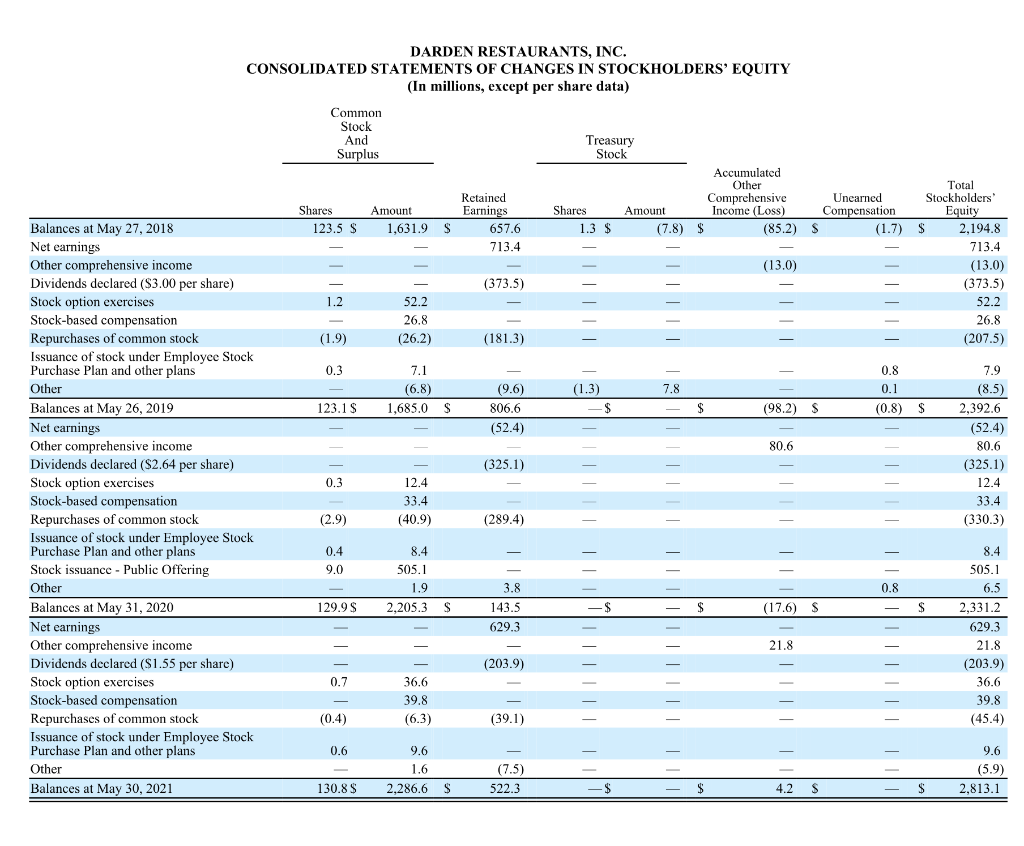
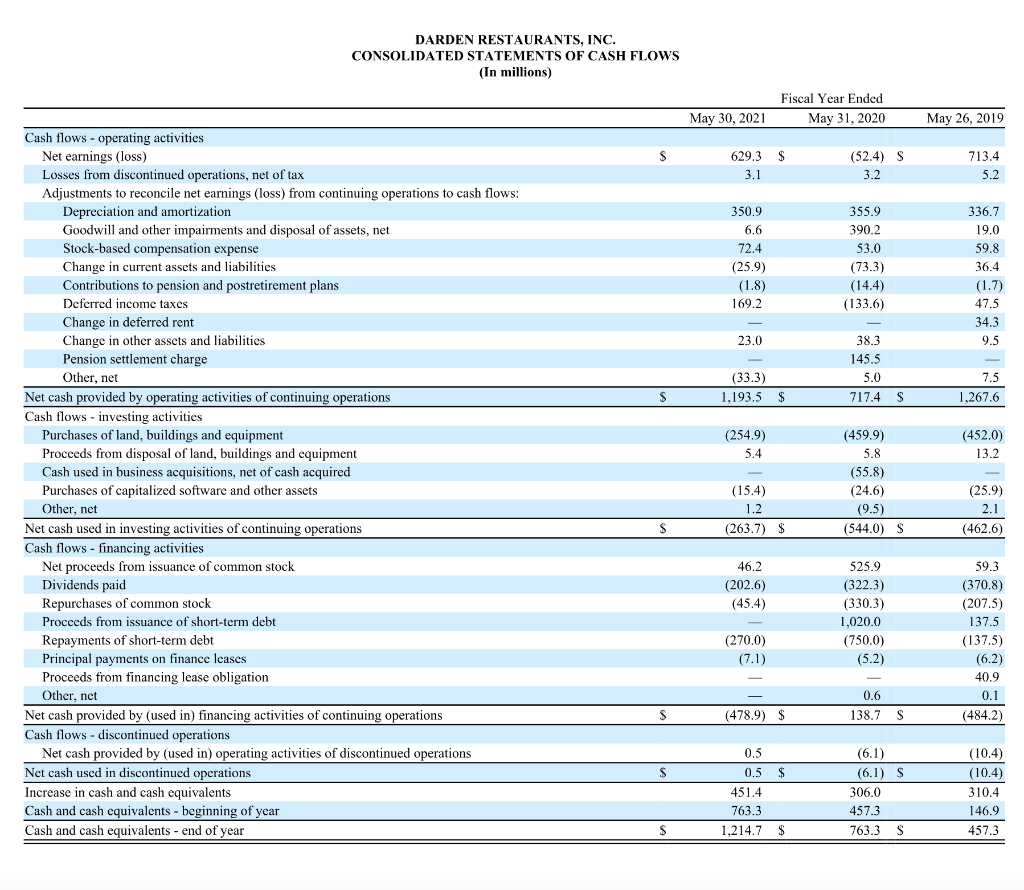
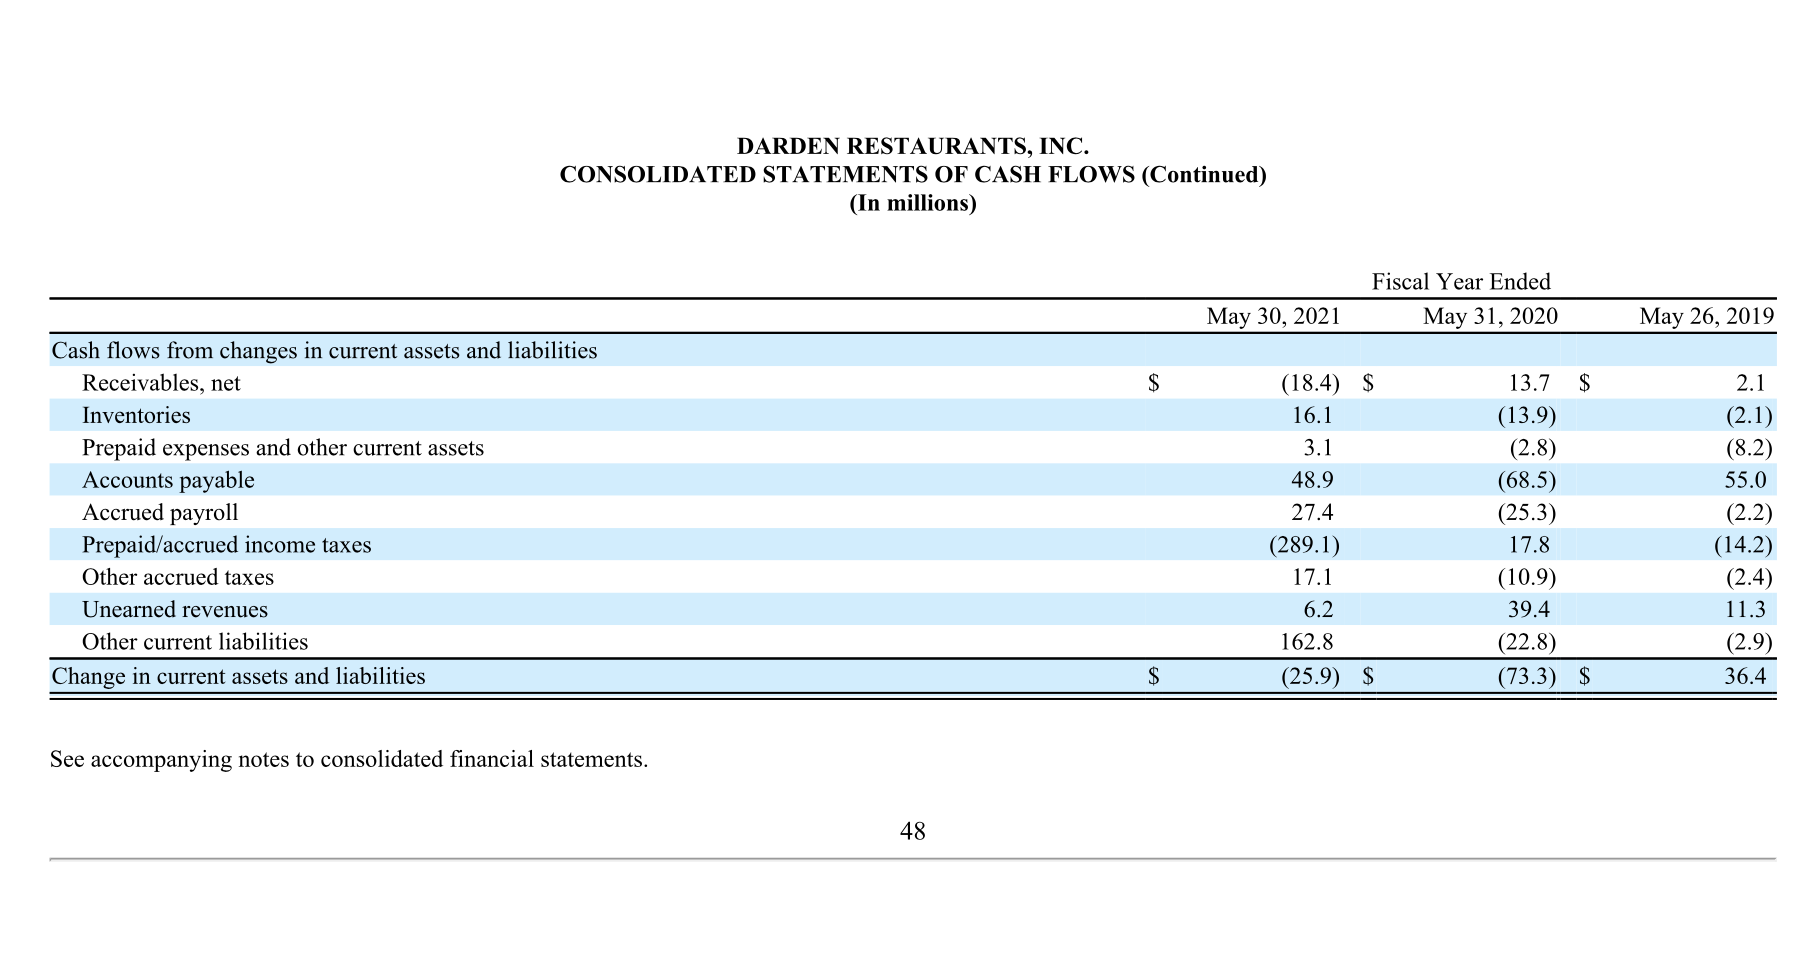
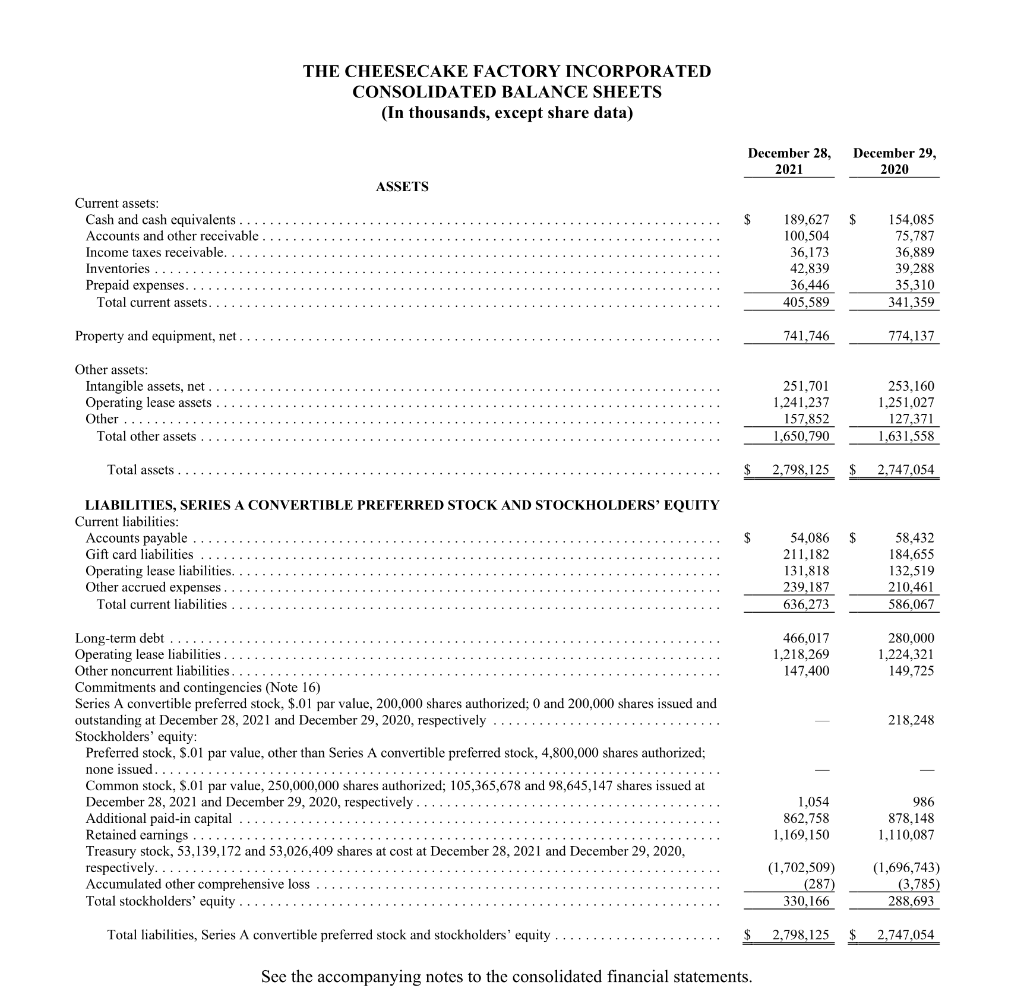
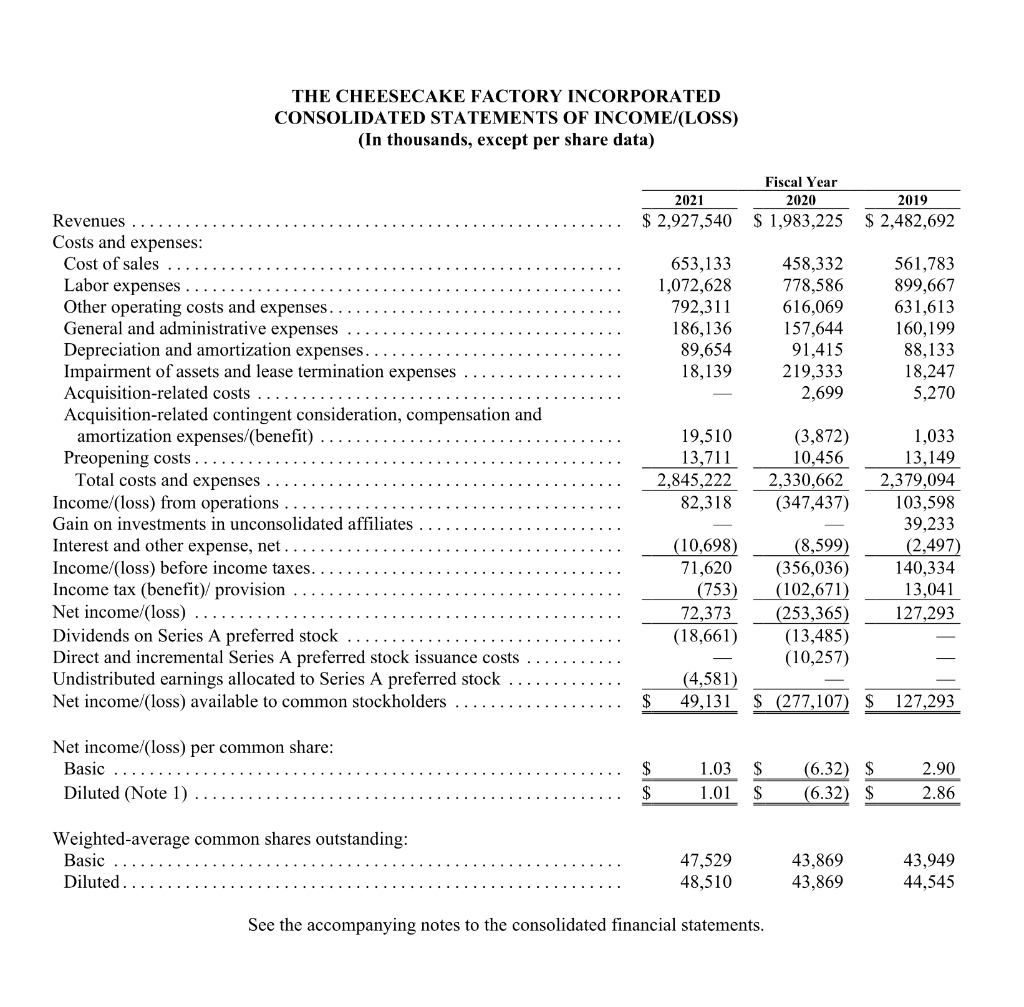
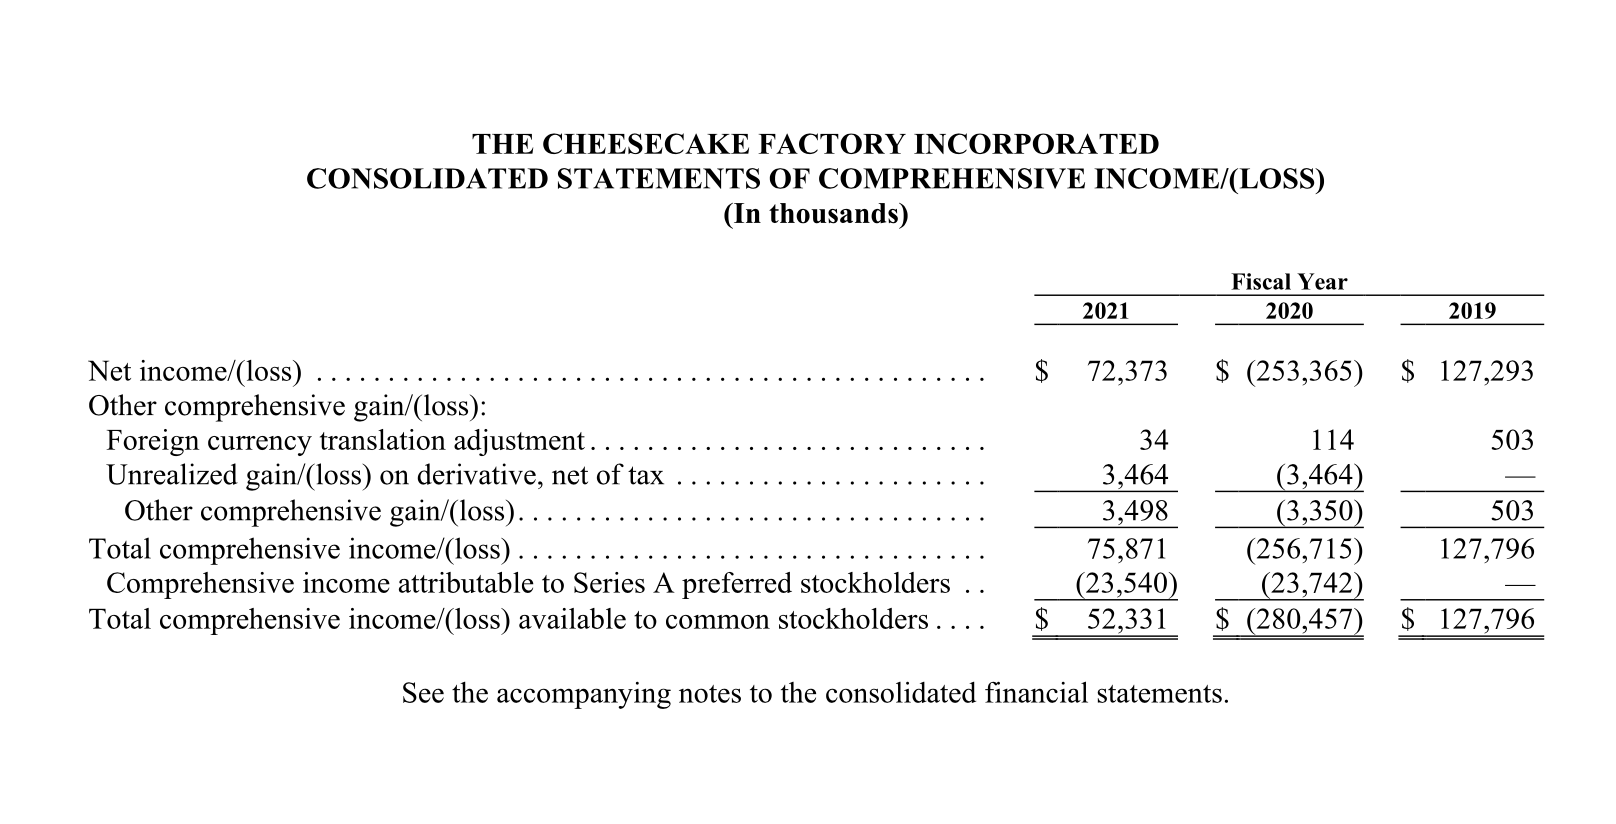
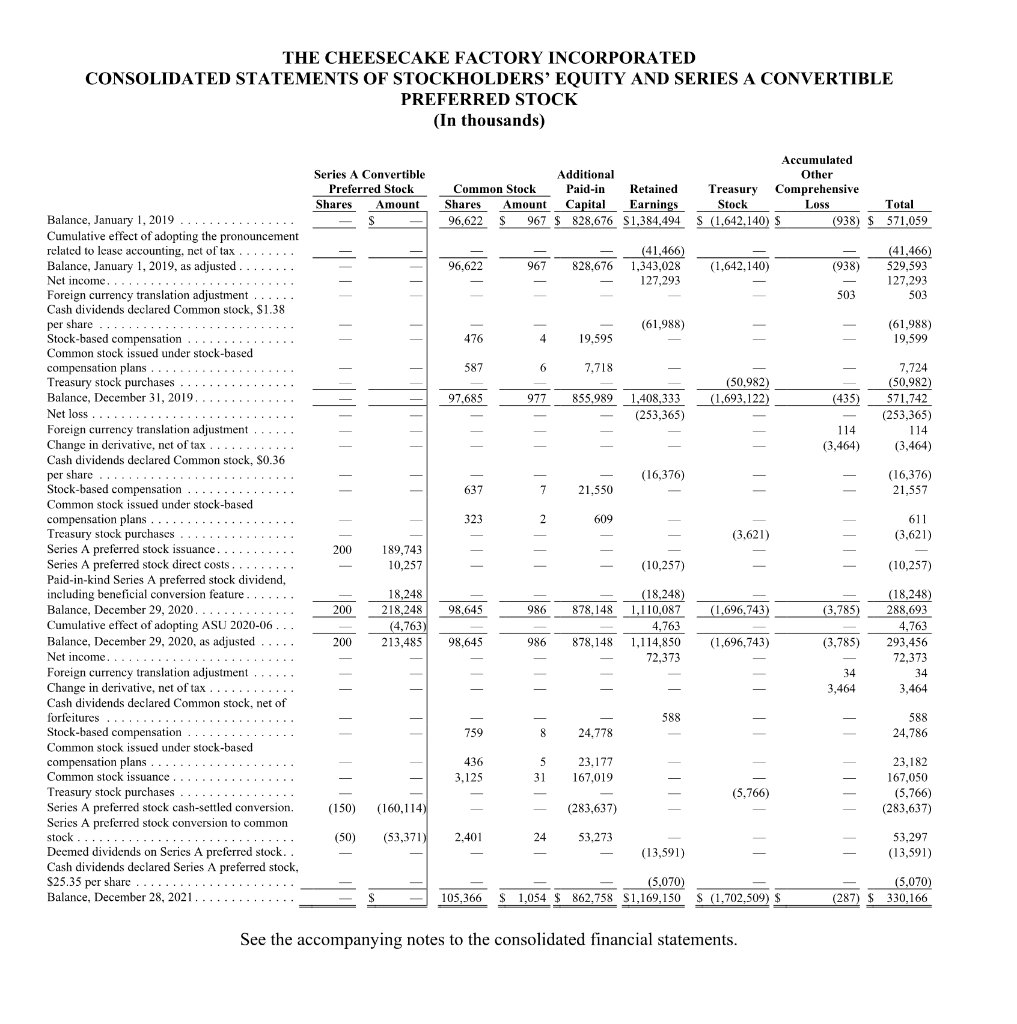
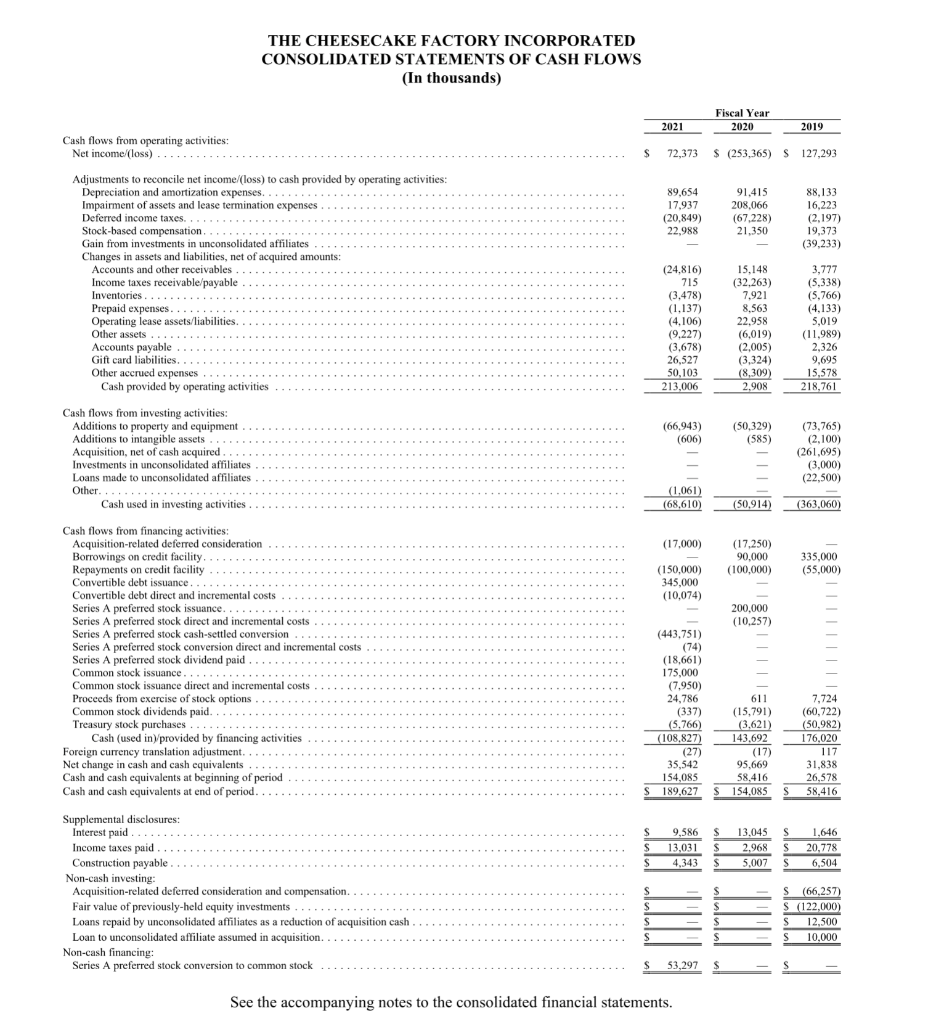
Using the Darden Restaurants (Fiscal year 2021) and the Cheesecake Factory. (Fiscal year 2021) financial statements, calculate the current ratio. Choose the answer below that reflects the current ratio for each company. Darden: .16 Cheesecake: .11 Darden: 3.09 Cheesecake: 2.21 Darden: 0.64 Cheesecake: 1.01 Darden: 1.01 Cheesecake: 0.64 ooo DARDEN RESTAURANTS, INC. CONSOLIDATED STATEMENTS OF EARNINGS (In millions, except per share data) $ Sales Costs and expenses: Food and beverage Restaurant labor Restaurant expenses Marketing expenses General and administrative expenses Depreciation and amortization Impairments and disposal of assets, net Goodwill impairment Total operating costs and expenses Operating income Interest, net Other (income) expense, net Earnings (loss) before income taxes Income tax expense (benefit) Earnings (loss) from continuing operations Losses from discontinued operations, net of tax benefit of $3.2, $0.9 and $1.8, respectively Net earnings (loss) Basic net earnings per share: Earnings (loss) from continuing operations Losses from discontinued operations Net earnings (loss) Diluted net earnings per share: Earnings (loss) from continuing operations Losses from discontinued operations Net earnings (loss) Average number of common shares outstanding: Basic Diluted See accompanying notes to consolidated financial statements. $ $ $ $ $ $ $ $ $ Fiscal Year Ended May 31, 2020 7,806.9 $ 2,240.8 2,682.6 1,475.1 238.0 376.4 355.9 221.0 169.2 7,759.0 $ 47.9 $ 57.3 151.6 (161.0) S (111.8) (49.2) $ (3.2) (52.4) $ (0.40) S (0.03) (0.43) S (0.40) $ (0.03) (0.43) $ 122.7 122.7 May 30, 2021 7,196.1 2,072.1 2,286.3 1,344.2 91.1 396.2 350.9 6.6 6,547.4 $ 648.7 $ 63.5 8.7 576.5 $ (55.9) $ 632.4 (3.1) 629.3 $ 4.85 $ (0.02) 4.83 $ 4.80 $ (0.03) 4.77 $ 130.4 131.8 $ May 26, 2019 8,510.4 2,412.5 2,771.1 1,477.8 255.3 405.5 336.7 19.0 7,677.9 832.5 50.2 782.3 63.7 718.6 (5.2) 713.4 5.82 (0.04) 5.78 5.73 (0.04) 5.69 123.5 125.4 Net earnings (loss) DARDEN RESTAURANTS, INC. CONSOLIDATED STATEMENTS OF COMPREHENSIVE INCOME (In millions) May 30, 2021 629.3 0.7 16.5 4.6 21.8 651.1 $ Foreign currency adjustment Change in fair value of derivatives and amortization of unrecognized gains and losses on derivatives, net of taxes of $0.4, $(0.3) and $(0.1), respectively Net unamortized gain (loss) arising during period, including amortization of unrecognized net actuarial loss, net of taxes of $1.5, $30.8 and $(6.4), respectively Other comprehensive income (loss) $ Total comprehensive income $ See accompanying notes to consolidated financial statements. Fiscal Year Ended May 31, 2020 (52.4) $ 5.5 (17.6) 92.7 80.6 $ 28.2 $ $ $ $ May 26, 2019 713.4 0.6 5.6 (19.2) (13.0) 700.4 ASSETS Current assets: Cash and cash equivalents Receivables, net Inventories Prepaid income taxes Prepaid expenses and other current assets Total current assets Land, buildings and equipment, net Operating lease right-of-use assets Goodwill Trademarks Other assets Total assets LIABILITIES AND STOCKHOLDERS' EQUITY Current liabilities: Accounts payable Short-term debt Accrued payroll Accrued income taxes Other accrued taxes Unearned revenues Other current liabilities DARDEN RESTAURANTS, INC. CONSOLIDATED BALANCE SHEETS (In millions) $ S $ $ Total current liabilities. Long-term debt Deferred income taxes Operating lease liabilities - non-current Other liabilities Total liabilities $ Stockholders' equity: Common stock and surplus, no par value. Authorized 500.0 shares; issued 130.8 and 129.9 shares, respectively; outstanding 130.8 and 129.9 shares, respectively Preferred stock, no par value. Authorized 25.0 shares; none issued and outstanding Retained earnings Accumulated other comprehensive income (loss) Total stockholders' equity Total liabilities and stockholders' equity See accompanying notes to consolidated financial statements. S $ $ May 30, 2021 1,214.7 68.2 190.8 337.2 60.2 1,871.1 2,869.2 3,776.4 1,037.4 806.3 295.7 10,656.1 $ $ S 304.5 S 177.4 35.9 60.5 474.2 795.8 1,848.3 S 929.8 221.6 4,088.5 754.8 7,843.0 2.286.6 522.3 4.2 2,813.1 S 10,656.1 $ S May 31, 2020 763.3 49.8 206.9 18.4 63.0 1,101.4 2,756.9 3,969.2 1,037.4 805.9 275.3 9,946.1 249.4 270.0 150.0 6.2 43.4 467.9 605.9 1,792.8 928.8 56.1 4,276.3 560.9 7,614.9 2,205.3 143.5 (17.6) 2,331.2 9,946.1 DARDEN RESTAURANTS, INC. CONSOLIDATED STATEMENTS OF CHANGES IN STOCKHOLDERS' EQUITY (In millions, except per share data) Common Stock And Surplus Treasury Stock Accumulated Other Comprehensive Income (Loss) Retained Earnings. Balances at May 27, 2018 Net earnings Other comprehensive income Dividends declared ($3.00 per share) Stock option exercises Stock-based compensation Repurchases of common stock Issuance of stock under Employee Stock Purchase Plan and other plans Other Balances at May 26, 2019 Net earnings Other comprehensive income Dividends declared ($2.64 per share) Stock option exercises Stock-based compensation Repurchases of common stock Issuance of stock under Employee Stock Purchase Plan and other plans Stock issuance - Public Offering Other Balances at May 31, 2020 Net earnings Other comprehensive income Dividends declared ($1.55 per share) Stock option exercises Stock-based compensation Repurchases of common stock Issuance of stock under Employee Stock Purchase Plan and other plans Other Balances at May 30, 2021 Shares 123.5 S 1.2 (1.9) 0.3 123.1 $ - 0.3 (2.9) 0.4 9.0 129.9 S 0.7 (0.4) 0.6 130.8 S Amount 1,631.9 S 52.2 26.8 (26.2) 7.1 (6.8) 1,685.0 $ 12.4 33.4 (40.9) 8.4 505.1 1.9 2,205.3 S 36.6 39.8 (6.3) 9.6 1.6 2,286.6 S 657.6 713.4 (373.5) (181.3) (9.6) 806.6 (52.4) (325.1) (289.4) 3.8 143.5 629.3 (203.9) (39.1) (7.5) 522.3 Shares 1.3 $ | (1.3) $ |||||| Amount ||||||| ||||||||||||||||||||| -$ (7.8) 7.8 $ $ (85.2) (13.0) (98.2) S 80.6 (17.6) S 21.8 S 4.2 $ Total Stockholders' Equity 2,194.8 713.4 (13.0) (373.5) 52.2 26.8 (207.5) 7.9 (8.5) 2,392.6 (52.4) 80.6 (325.1) 12.4 33.4 (330.3) 8.4 505.1 6.5 2,331.2 629.3 21.8 (203.9) 36.6 39.8 (45.4) 9.6 (5.9) Unearned Compensation (1.7) 0.8 0.1 (0.8) S 0.8 S $ $ 2,813.1 DARDEN RESTAURANTS, INC. CONSOLIDATED STATEMENTS OF CASH FLOWS (In millions) Cash flows operating activities Net earnings (loss) Losses from discontinued operations, net of tax Adjustments to reconcile net earnings (loss) from continuing operations to cash flows: Depreciation and amortization Goodwill and other impairments and disposal of assets, net Stock-based compensation expense Change in current assets and liabilities Contributions to pension and postretirement plans Deferred income taxes Change in deferred rent Change in other assets and liabilities Pension settlement charge Other, net Net cash provided by operating activities of continuing operations Cash flows investing activities Purchases of land, buildings and equipment Proceeds from disposal of land, buildings and equipment Cash used in business acquisitions, net of cash acquired Purchases of capitalized software and other assets Other, net Net cash used in investing activities of continuing operations Cash flows financing activities Net proceeds from issuance of common stock. Dividends paid Repurchases of common stock. Proceeds from issuance of short-term debt Repayments of short-term debt Principal payments on finance leases Proceeds from financing lease obligation Other, net Net cash provided by (used in) financing activities of continuing operations Cash flows discontinued operations Net cash provided by (used in) operating activities of discontinued operations Net cash used in discontinued operations Increase in cash and cash equivalents Cash and cash equivalents - beginning of year Cash and cash equivalents - end of year S $ $ $ $ $ May 30, 2021 Fiscal Year Ended May 31, 2020 629.3 $ 3.1 350.9 6.6 72.4 (25.9) (1.8) 169.2 23.0 (33.3) 1,193.5 $ (254.9) 5.4 (15.4) 1.2 (263.7) $ 46.2 (202.6) (45.4) (270.0) (7.1) (478.9) $ 0.5 0.5 $ 451.4 763.3 1,214.7 $ (52.4) S 3.2 355.9 390.2 53.0 (73.3) (14.4) (133.6) 38.3 145.5 5.0 717.4 S (459.9) 5.8 (55.8) (24.6) (9.5) (544.0) S 525.9 (322.3) (330.3) 1,020.0 (750.0) (5.2) 0.6 138.7 S (6.1) (6.1) S $ 306.0 457.3 763.3 May 26, 2019 713.4 5.2 336.7 19.0 59.8 36.4 (1.7) 47.5 34.3 9.5 7.5 1,267.6 (452.0) 13.2 (25.9) 2.1 (462.6) 59.3 (370.8) (207.5) 137.5 (137.5) (6.2) 40.9 0.1 (484.2) (10.4) (10.4) 310.4 146.9 457.3 DARDEN RESTAURANTS, INC. CONSOLIDATED STATEMENTS OF CASH FLOWS (Continued) (In millions) Cash flows from changes in current assets and liabilities Receivables, net Inventories Prepaid expenses and other current assets Accounts payable Accrued payroll Prepaid/accrued income taxes Other accrued taxes Unearned revenues Other current liabilities Change in current assets and liabilities See accompanying notes to consolidated financial statements. 48 $ $ May 30, 2021 Fiscal Year Ended May 31, 2020 (18.4) $ 16.1 3.1 48.9 27.4 (289.1) 17.1 6.2 162.8 (25.9) $ 13.7 $ (13.9) (2.8) (68.5) (25.3) 17.8 (10.9) 39.4 (22.8) (73.3) $ May 26, 2019 2.1 (2.1) (8.2) 55.0 (2.2) (14.2) (2.4) 11.3 (2.9) 36.4 THE CHEESECAKE FACTORY INCORPORATED CONSOLIDATED BALANCE SHEETS (In thousands, except share data) ASSETS Current assets: Cash and cash equivalents Accounts and other receivable Income taxes receivable. Inventories... Prepaid expenses. Total current assets Property and equipment, net Other assets: Intangible assets, net Operating lease assets Other ...... Total other assets. Total assets LIABILITIES, SERIES A CONVERTIBLE PREFERRED STOCK AND STOCKHOLDERS' EQUITY Current liabilities: Accounts payable $ Gift card liabilities Operating lease liabilities. Other accrued expenses. Total current liabilities Long-term debt Operating lease liabilities Other noncurrent liabilities. Commitments and contingencies (Note 16) Series A convertible preferred stock, $.01 par value, 200,000 shares authorized; 0 and 200,000 shares issued and Dance outstanding at December 28, 2021 and December 29, 2020, respectively Stockhold Stockholders' equity: Da Ca Preferred stock, S.01 par value, other than Series A convertible preferred stock, 4,800,000 shares authorized; none issued. none issue ******* Common stock, $.01 par value, 250,000,000 shares authorized; 105,365,678 and 98,645,147 shares issued at December 28, 2021 and December 29, 2020, respectively Additional paid-in capital Retained earnings Treasury stock, 53,139,172 and 53,026,409 shares at cost at December 28, 2021 and December 29, 2020, respectively... Accumulated other comprehensive loss Total stockholders' equity Total liabilities, Series A convertible preferred stock and stockholders' equity December 28, 2021 $ See the accompanying notes to the consolidated financial statements. December 29, 2020 154,085 75,787 36,889 39,288 35.310 341,359 774,137 253,160 1,251,027 127,371 1,631,558 2,747,054 58,432 184,655 132,519 210,461 586.067 280,000 1,224,321 149,725 218,248 986 878,148 1,110,087 (1,696,743) (3,785) 288,693 2,747,054 189,627 $ 100,504 36,173 42,839 36,446 405,589 741,746 251,701 1,241,237 157,852 1,650,790 2,798,125 54,086 211,182 131,818 239,187 636,273 466,017 1,218,269 147,400 1,054 862,758 1,169,150 (1,702,509) (287) 330,166 2,798,125 $ THE CHEESECAKE FACTORY INCORPORATED CONSOLIDATED STATEMENTS OF INCOME/(LOSS) (In thousands, except per share data) Fiscal Year 2020 2021 2019 $2,927,540 $ 1,983,225 $ 2,482,692 653,133 458,332 561,783 1,072,628 778,586 899,667 792,311 616,069 631,613 186,136 157,644 160,199 89,654 91,415 88,133 18,139 219,333 18,247 2,699 5,270 19,510 (3,872) 1,033 13,711 10,456 13,149 2,845,222 2,330,662 2,379,094 82,318 (347,437) 103,598 39,233 (10,698) (8,599) (2,497) 71,620 (356,036) 140,334 (102,671) 13,041 72,373 (253,365) 127,293 (18,661) (13,485) (10,257) (4,581) 49,131 $ (277,107) $ 127,293 1.03 $ (6.32) $ 2.90 1.01 $ (6.32) $ 2.86 43,949 44,545 Revenues Costs and expenses: Cost of sales Labor expenses Other operating costs and expenses. General and administrative expenses Depreciation and amortization expenses.. Impairment of assets and lease termination expenses Acquisition-related costs Acquisition-related contingent consideration, compensation and amortization expenses/(benefit) Preopening costs.. Total costs and expenses Income/(loss) from operations. Gain on investments in unconsolidated affiliates Interest and other expense, net.. Income/(loss) before income taxes. Income tax (benefit)/ provision Net income/(loss) Dividends on Series A preferred stock Direct and incremental Series A preferred stock issuance costs Undistributed earnings allocated to Series A preferred stock Net income/(loss) available to common stockholders Net income/(loss) per common share: Basic Diluted (Note 1) Weighted-average common shares outstanding: Basic Diluted.. $ $ (753) 47,529 48,510 See the accompanying notes to the consolidated financial statements. 43,869 43,869 THE CHEESECAKE FACTORY INCORPORATED CONSOLIDATED STATEMENTS OF COMPREHENSIVE INCOME/(LOSS) (In thousands) Fiscal Year 2020 2021 2019 $ 72,373 $ (253,365) $ 127,293 34 114 503 3,464 (3,464) 3,498 (3,350) 503 (256,715) 127,796 75,871 (23,540) (23,742) $ 52,331 $ (280,457) $ 127,796 Net income/(loss) Other comprehensive gain/(loss): Foreign currency translation adjustment... Unrealized gain/(loss) on derivative, net of tax Other comprehensive gain/(loss). Total comprehensive income/(loss). Comprehensive income attributable to Series A preferred stockholders Total comprehensive income/(loss) available to common stockholders.. See the accompanying notes to the consolidated financial statements. THE CHEESECAKE FACTORY INCORPORATED CONSOLIDATED STATEMENTS OF STOCKHOLDERS' EQUITY AND SERIES A CONVERTIBLE PREFERRED STOCK (In thousands) Accumulated Other Series A Convertible Preferred Stock Additional Paid-in Shares Amount $ Common Stock Retained Treasury Comprehensive Shares Amount Capital Earnings Stock Loss 96,622 $ 967 $828,676 S1,384,494 S (1,642,140) $ Balance, January 1, 2019. Cumulative effect of adopting the pronouncement related to lease accounting, net of tax Balance, January 1, 2019, as adjusted 96,622 967 (41,466) 828,676 1,343,028 127,293 (1,642,140) Net income.......... Foreign currency translation adjustment ..... Cash dividends declared Common stock, $1.38 per share... (61,988) Stock-based compensation 476 4 19,595 Common stock issued under stock-based compensation plans. 587 6 7,718 Treasury stock purchases (50,982) (1,693,122) Balance, December 31, 2019 97,685 977 855.989 1,408,333 (253,365) Net loss.... ******* Foreign currency translation adjustment Change in derivative, net of tax. Cash dividends declared Common stock, $0.36 per share... (16,376) Stock-based compensation 637 7 21.550 Common stock issued under stock-based compensation plans 323 2 609 Treasury stock purchases (3,621) Series A preferred stock issuance. 189,743 Series A preferred stock direct costs 10,257 (10,257) Paid-in-kind Series A preferred stock dividend, including beneficial conversion feature Balance, December 29, 2020... 18,248 (1,696,743) 218,248 98,645 (4,763) Cumulative effect of adopting ASU 2020-06. Curcial (18,248) 986 878,148 1,110,087 4,763 1,114,850 72.373 Balance, December 29, 2020, as adjusted 213,485 98,645 986 878,148 (1,696,743) Net income..... Foreign currency translation adjustment Change in derivative, net of tax . . . . . . Cash dividends declared Common stock, net of forfeitures 588 ******** Stock-based compensation 759 24,778 Common stock issued under stock-based compensation plans.... 436 23.177 167,019 Common stock issuance 3,125 31 Treasury stock purchases (5,766) (150) (160,114) (283,637) Series A preferred stock cash-settled conversion. Series A preferred stock conversion to common stock................ Deemed dividends on Series A preferred stock.. Cash dividends declared Series A preferred stock, (50) (53,371) 2,401 24 53,273 ..... (13,591) (5,070) $25.35 per share......... Balance, December 28, 2021. 105,366 $ 1,054 $ 862,758 $1,169,150 $ (1,702,509) $ See the accompanying notes to the consolidated financial statements. 200 200 200 | in m 8 || Total (938) $571,059 - (41,466) (938) 529.593 127,293 503 503 (61,988) 19,599 7,724 (50,982) (435) 571,742 114 (253,365) 114 (3,464) (3,464) (16,376) 21,557 611 (3,621) (10,257) (18,248) 288,693 4,763 293,456 72,373 34 3,464 588 24,786 23,182 167,050 (5,766) (283,637) 53,297 (13,591) (5,070) (287) $330,166 (3,785) (3,785) 34 3.464 ||| || THE CHEESECAKE FACTORY INCORPORATED CONSOLIDATED STATEMENTS OF CASH FLOWS (In thousands) Fiscal Year 2020 2021 2019 72,373 $ (253,365) $ 127,293 89,654 91.415 88,133 17,937 208,066 16,223 (20,849) (67,228) (2,197) 22,988 21,350 19,373 (39,233) 15,148 3,777 (24,816) 715 (3,478) (5,338) (32,263) 7,921 (5,766) (1,137) 8.563 (4,106) (4,133) 5,019 22,958 (9,227) (6,019) (11,989) 2,326 (3,678) (2,005) 26,527 (3,324) 9,695 50,103 (8,309) 15,578 213,006 2,908 218,761 (73,765) (66,943) (606) (50,329) (585) (2,100) (261,695) (3,000) (22,500) (1,061) (68,610) (50,914) (363,060) (17,000) (17,250) 90,000 335,000 (150,000) (100,000) (55,000) 345,000 (10,074) 200,000 (10,257) (443,751) (74) (18,661) 175,000 (7,950) 24,786 611 7,724 (337) (15,791) (60,722) (5,766) (3,621) (50,982) (108,827) 143,692 176,020 (27) (17) 117 95,669 31,838 35,542 154,085 58,416 26,578 $ 189,627 $ 154,085 58,416 $ 9,586 $ 13,045 $ 13,031 $ 2,968 S 4,343 $ 5,007 S $ S S S 53,297 See the accompanying notes to the consolidated financial statements. Cash flows from operating activities: Net income/(loss). Adjustments to reconcile net income/(loss) to cash provided by operating activities: Depreciation and amortization expenses...... Impairment of assets and lease termination expenses Deferred income taxes...... Stock-based compensation... Gain from investments in unconsolidated affiliates Changes in assets and liabilities, net of acquired amounts: Accounts and other receivables Income taxes receivable/payable Inventories.... Prepaid expenses.... Operating lease assets/liabilities. Other assets... Accounts payable Gift card liabilities.. Other accrued expenses Cash provided by operating activities Cash flows from investing activities: Additions to property and equipment Additions to intangible assets Acquisition, net of cash acquired. Investments in unconsolidated affiliates Loans made to unconsolidated affiliates Other........ Cash used in investing activities. Cash flows from financing activities: Acquisition-related deferred consideration. Borrowings on credit facility. Repayments on credit facility Convertible debt issuance. Convertible debt direct and incremental costs Series A preferred stock issuance.......... Series A preferred stock direct and incremental costs Series A preferred stock cash-settled conversion Series A preferred stock conversion direct and incremental costs Series A preferred stock dividend paid Common stock issuance....... Common stock issuance direct and incremental costs Proceeds from exercise of stock options Common stock dividends paid. Treasury stock purchases..... Cash (used in)/provided by financing activities Foreign currency translation adjustment. Net change in cash and cash equivalents Cash and cash equivalents at beginning of period Cash and cash equivalents at end of period. Supplemental disclosures: Interest paid. Income taxes paid Construction payable. Non-cash investing: Acquisition-related deferred consideration and compensation. Fair value of previously-held equity investments....... Loans repaid by unconsolidated affiliates as a reduction of acquisition cash Loan to unconsolidated affiliate assumed in acquisition. Non-cash financing: Series A preferred stock conversion to common stock $ 1813) 1,646 20,778 6,504 S (66,257) S (122,000) 12,500 10,000 Using the Darden Restaurants (Fiscal year 2021) and the Cheesecake Factory. (Fiscal year 2021) financial statements, calculate the Return on Equity ratio. Choose the answer below that reflects the Return on Equity for each company. Darden: 22.4% Cheesecake: 21.9% Darden: 34.9% Cheesecake: 20.8% Darden: 11.0% Cheesecake: 7.5% Darden: 21.9% Cheesecake: 22.4% ooo