

Answered step by step
Verified Expert Solution
Question
1 Approved Answer
Using the data in the following table, and the fact that the correlation of A and B is 0.65, calculate the volatility (standard deviation) of
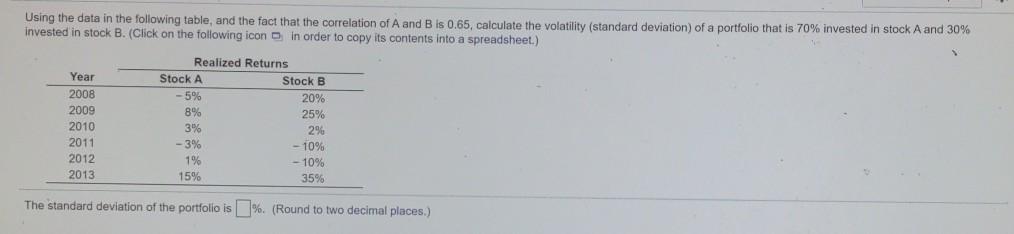
Using the data in the following table, and the fact that the correlation of A and B is 0.65, calculate the volatility (standard deviation) of a portfolio that is 70% invested in stock A and 30% Invested in stock B. (Click on the following icon in order to copy its contents into a spreadsheet.) Year 2008 2009 2010 2011 2012 2013 Realized Returns Stock A Stock B -5% 20% 8% 25% 3% 29% - 3% - 10% 1% -10% 15% 35% The standard deviation of the portfolio is (Round to two decimal places.)
Step by Step Solution
There are 3 Steps involved in it
Step: 1

Get Instant Access to Expert-Tailored Solutions
See step-by-step solutions with expert insights and AI powered tools for academic success
Step: 2

Step: 3
Ace Your Homework with AI
Get the answers you need in no time with our AI-driven, step-by-step assistance
Get Started
Public Finance In Theory And Practice
Authors: Richard Abel Musgrave, Peggy B. Muscrave
5th Edition
0070441278, 978-0070441279