

Answered step by step
Verified Expert Solution
Question
1 Approved Answer
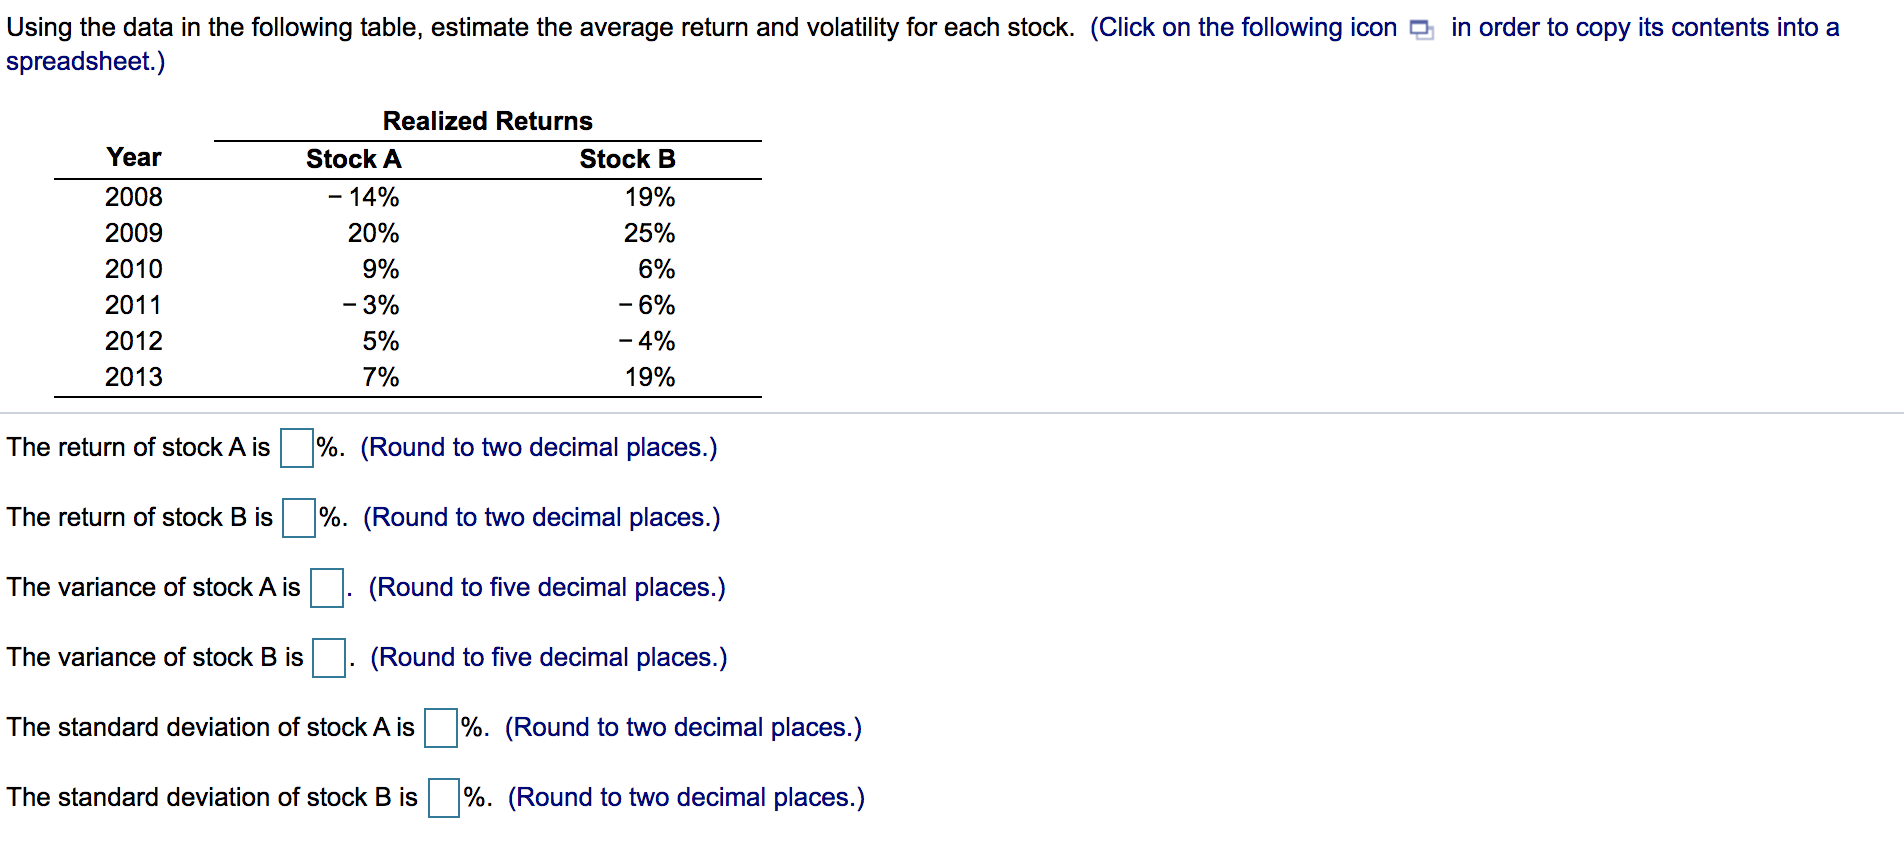
Using the data in the following table, estimate the average return and volatility for each stock. (Click on the following icon o in order to
Step by Step Solution
There are 3 Steps involved in it
Step: 1

Get Instant Access to Expert-Tailored Solutions
See step-by-step solutions with expert insights and AI powered tools for academic success
Step: 2

Step: 3
Ace Your Homework with AI
Get the answers you need in no time with our AI-driven, step-by-step assistance
Get Started
Credit Spreads Beginners Guide To Low Risk Secure Easy To Manage Consistent Profits For Long Term Wealth Creation
Authors: Casey Boon
1st Edition
1974677419, 978-1974677412