Answered step by step
Verified Expert Solution
Link Copied!

Question

1 Approved Answer

Using the data in the following table, estimate the average return and volatility for each stock. Realized Returns Year Stock A Stock B 2008 -
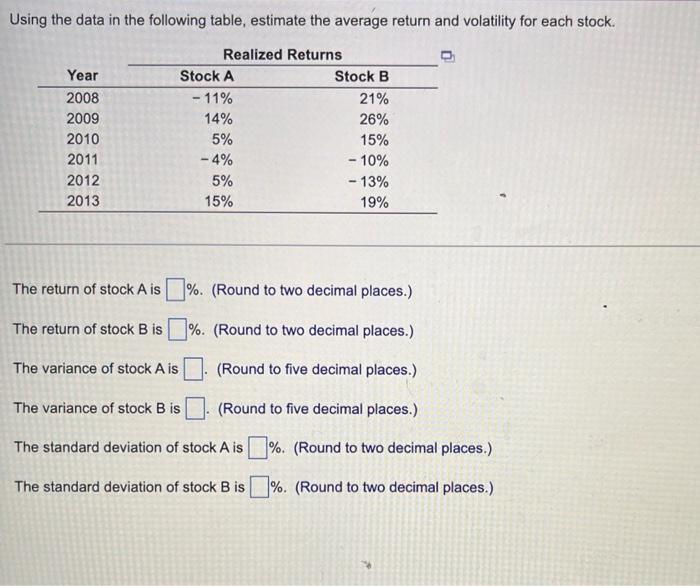
image text in transcribed
Using the data in the following table, estimate the average return and volatility for each stock. Realized Returns Year Stock A Stock B 2008 - 11% 21% 2009 14% 26% 2010 5% 15% 2011 - 4% - 10% 2012 5% - 13% 2013 15% 19% The return of stock A is%. (Round to two decimal places.) The return of stock B is%. (Round to two decimal places.) The variance of stock A is (Round to five decimal places.) The variance of stock B is (Round to five decimal places.) The standard deviation of stock A is %. (Round to two decimal places.) The standard deviation of stock B is %. (Round to two decimal places.)

Step by Step Solution

There are 3 Steps involved in it

Step: 1

blur-text-image

Get Instant Access to Expert-Tailored Solutions

See step-by-step solutions with expert insights and AI powered tools for academic success

Step: 2

blur-text-image

Step: 3

blur-text-image

Ace Your Homework with AI

Get the answers you need in no time with our AI-driven, step-by-step assistance

Get Started

Recommended Textbook for

Governance And The Market For Corporate Control

Authors: John L. Teall

1st Edition

0415397863,1317834704

More Books

Students also viewed these Finance questions

Question

How are the balance sheet and income statement connected?

Answered: 1 week ago