

Answered step by step
Verified Expert Solution
Question
1 Approved Answer
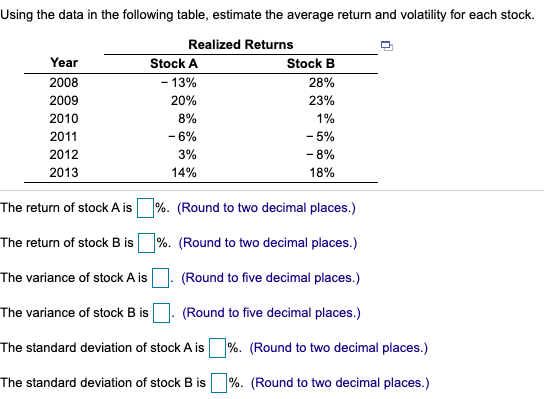
Using the data in the following table, estimate the average return and volatility for each stock. Year 2008 2009 2010 2011 2012 2013 Realized Returns
Step by Step Solution
There are 3 Steps involved in it
Step: 1

Get Instant Access to Expert-Tailored Solutions
See step-by-step solutions with expert insights and AI powered tools for academic success
Step: 2

Step: 3
Ace Your Homework with AI
Get the answers you need in no time with our AI-driven, step-by-step assistance
Get Started
Risk Management And Financial Institutions
Authors: John Hull
1st Edition
0132397900, 9780132397902