

Question
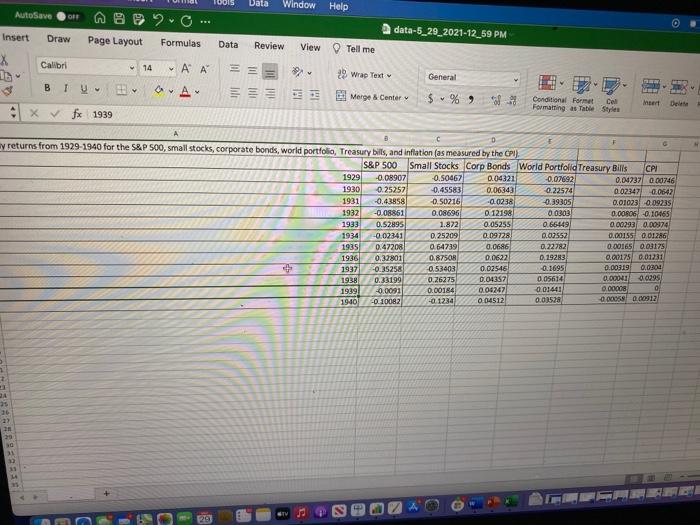
Using the data in the picture A. Compute the average return for each of the assets from 1929 to 1940 (the Great Depression) B. Compute
Using the data in the picture
A. Compute the average return for each of the assets from 1929 to 1940 (the Great Depression)
B. Compute the Variance and standard deviation for each of the assets from 1920 to 1940.
C. Which ass that was the riskiest during the Great Depression? How does that fit with your intuition?
Note: Notice that the answers for average return, variance and standard deviation must be entered in decimal format.
Step by Step Solution
There are 3 Steps involved in it
Step: 1

Get Instant Access to Expert-Tailored Solutions
See step-by-step solutions with expert insights and AI powered tools for academic success
Step: 2

Step: 3
Ace Your Homework with AI
Get the answers you need in no time with our AI-driven, step-by-step assistance
Get Started
43 Ways To Finance Your Feature Film A Comprehensive Analysis Of Film Finance
Authors: John W. Cones
3rd Edition
0809326930, 978-0809326938