Answered step by step
Verified Expert Solution
Question
1 Approved Answer
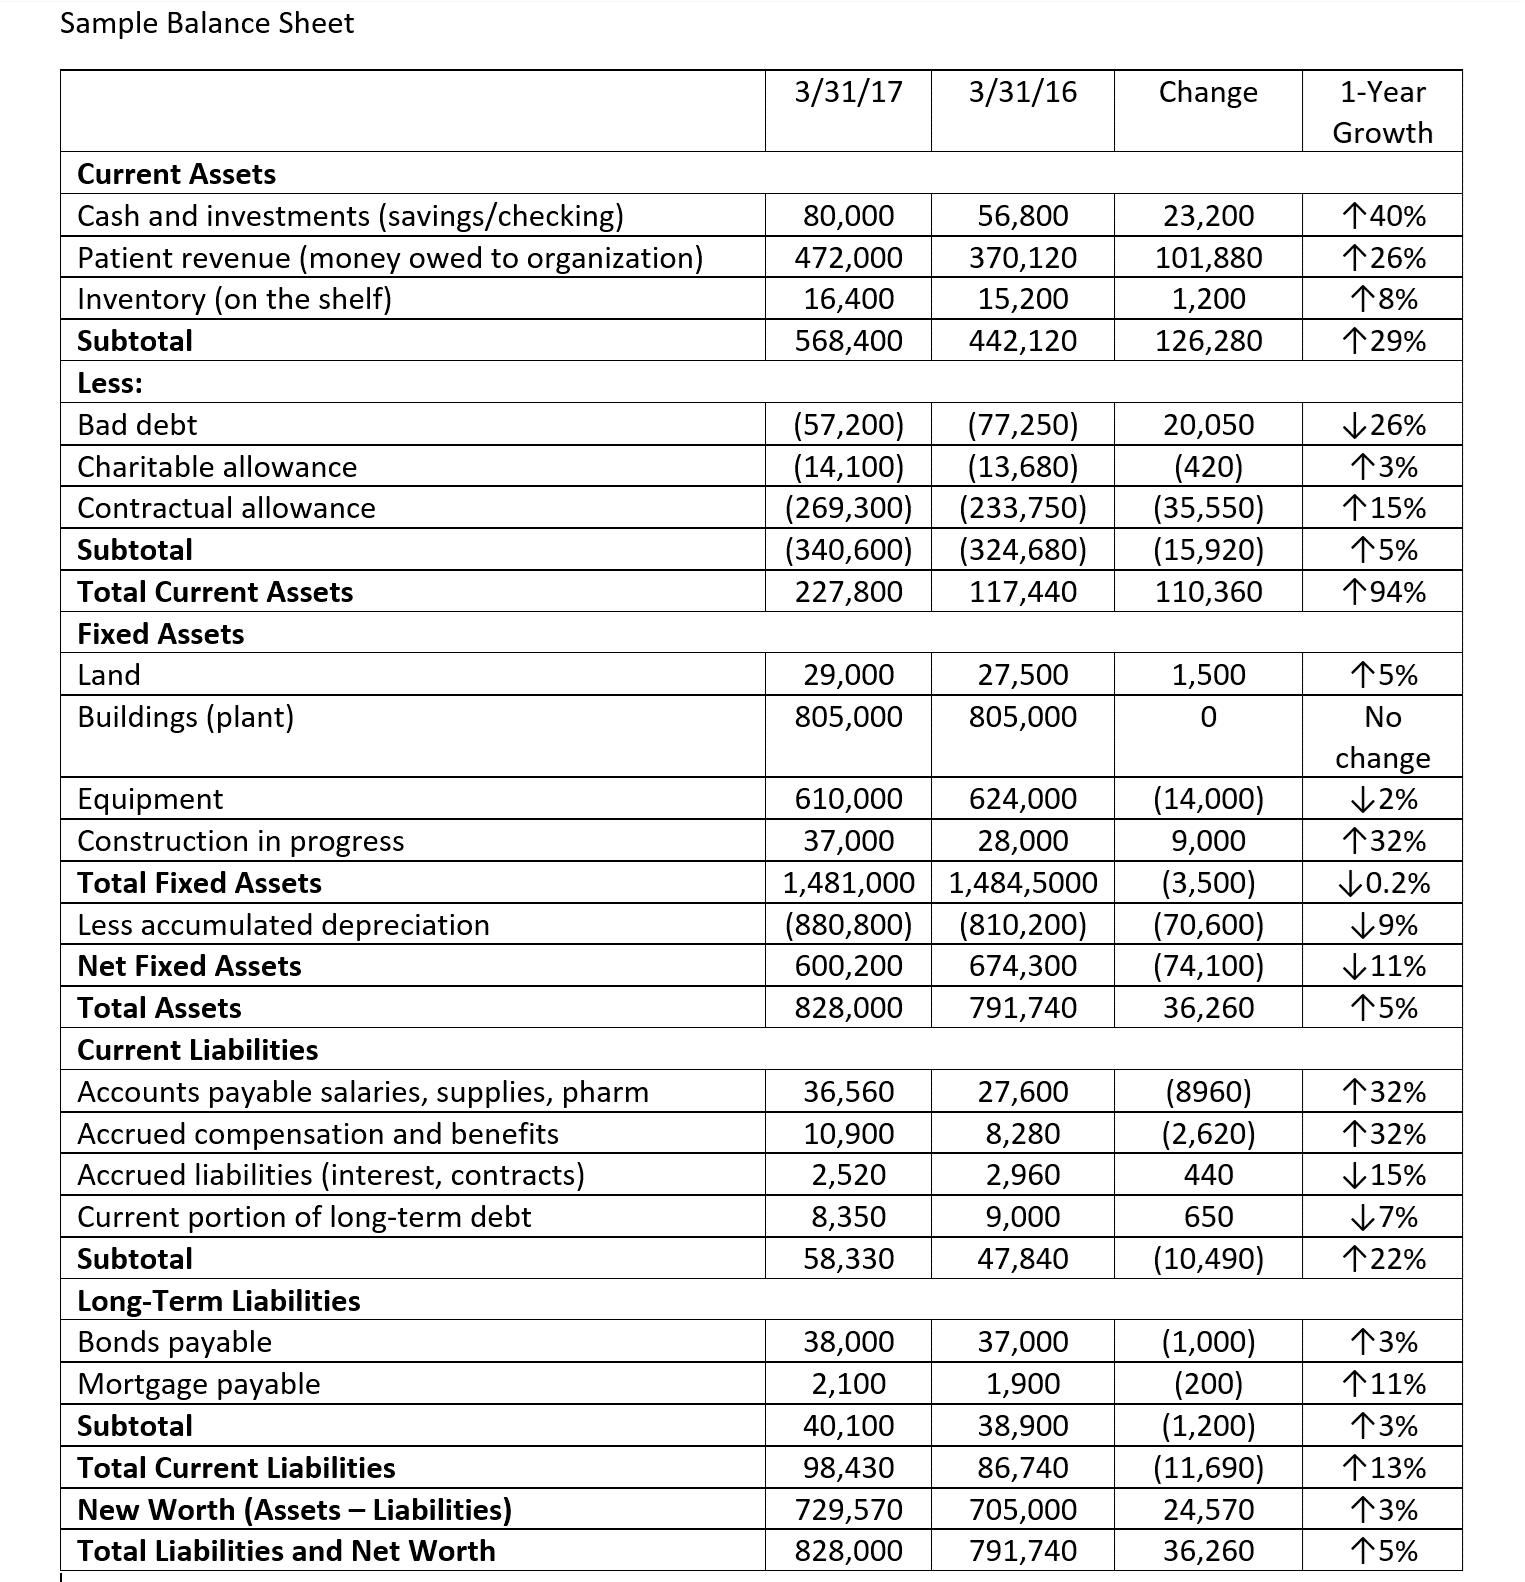
Using the data in the Sample Balance Sheet, calculate the current ratio, quick ratio, and the debt ratio What information do these ratios provide? If
- Using the data in the Sample Balance Sheet, calculate the current ratio, quick ratio, and the debt ratio
- What information do these ratios provide?
- If you were concerned about the result, what advice would you have for this organization?
- In what ways could these ratios be negatively impacted?
- When assessing the results of these ratios, what advice would you have for this organization if it was considering securing financing for a major capital expense?

Sample Balance Sheet Current Assets Cash and investments (savings/checking) Patient revenue (money owed to organization) Inventory (on the shelf) Subtotal Less: Bad debt Charitable allowance Contractual allowance Subtotal Total Current Assets Fixed Assets Land Buildings (plant) Equipment Construction in progress Total Fixed Assets Less accumulated depreciation Net Fixed Assets Total Assets Current Liabilities Accounts payable salaries, supplies, pharm Accrued compensation and benefits Accrued liabilities (interest, contracts) Current portion of long-term debt Subtotal Long-Term Liabilities Bonds payable Mortgage payable Subtotal Total Current Liabilities New Worth (Assets - Liabilities) Total Liabilities and Net Worth 3/31/17 3/31/16 Change 80,000 472,000 16,400 568,400 29,000 805,000 56,800 370,120 15,200 442,120 (57,200) (77,250) 20,050 (14,100) (13,680) (420) (269,300) (233,750) (35,550) (340,600) (324,680) (15,920) 227,800 117,440 110,360 36,560 10,900 2,520 8,350 58,330 27,500 805,000 610,000 624,000 37,000 28,000 1,481,000 1,484,5000 (880,800) (810,200) 600,200 674,300 828,000 791,740 27,600 8,280 2,960 9,000 47,840 23,200 101,880 1,200 126,280 38,000 2,100 40,100 98,430 729,570 705,000 828,000 791,740 1,500 0 (14,000) 9,000 (8960) (2,620) 440 650 (10,490) 37,000 (1,000) 1,900 (200) 38,900 (1,200) 86,740 (11,690) 24,570 36,260 1-Year Growth 40% 26% 8% 29% 26% 3% 15% 5% 194% (3,500) 0.2% (70,600) 9% (74,100) 11% 36,260 15% 5% No change 2% 132% 32% 132% 15% 7% 122% 3% 11% 13% 13% 3% 5%
Step by Step Solution
★★★★★
3.46 Rating (153 Votes )
There are 3 Steps involved in it
Step: 1
Current Ratio The current ratio shows the ability of the firm to pay its obligations as they fall due using its liquid assetsIts a liquidity ratio comparing the current assets to current liabilitiesTo ...
Get Instant Access to Expert-Tailored Solutions
See step-by-step solutions with expert insights and AI powered tools for academic success
Step: 2

Step: 3

Ace Your Homework with AI
Get the answers you need in no time with our AI-driven, step-by-step assistance
Get Started


