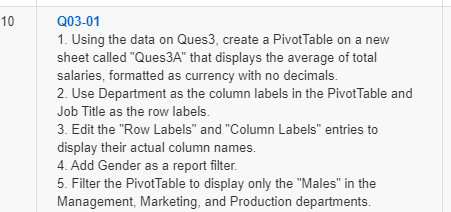
Using the data on Ques3, create a PivotTable on a new sheet called "Ques3A" that displays the average of total salaries, formatted as currency with no decimals. 2. Use Department as the column labels in the PivotTable and Job Title as the row labels. 3. Edit the "Row Labels" and "Column Labels" entries to display their actual column names. 4. Add Gender as a report filter. 5. Filter the PivotTable to display only the "Males" in the Management, Marketing, and Production departments.
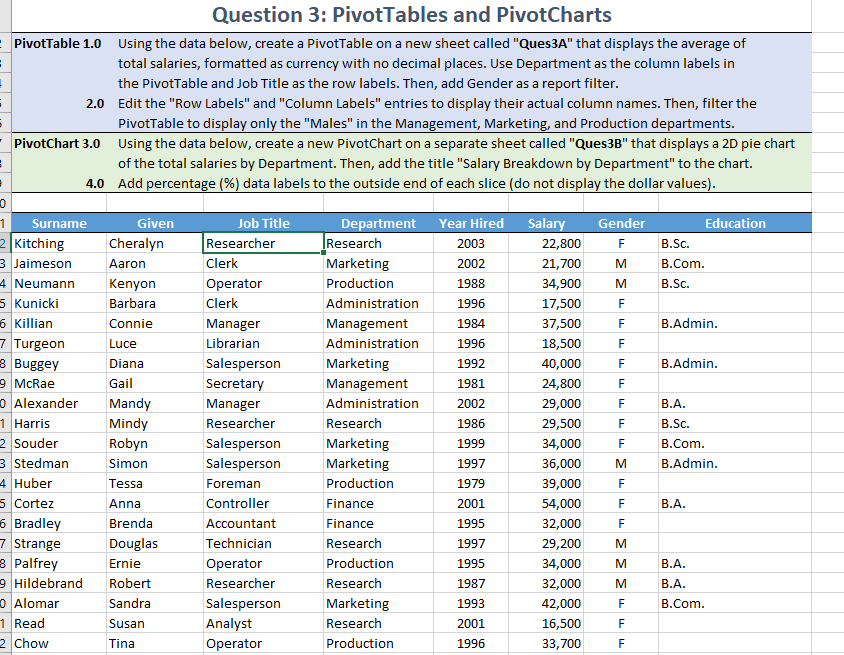
10 Q03-01 1. Using the data on Ques3, create a Pivot Table on a new sheet called "Ques3A" that displays the average of total salaries, formatted as currency with no decimals. 2. Use Department as the column labels in the Pivot Table and Job Title as the row labels. 3. Edit the "Row Labels" and "Column Labels" entries to display their actual column names. 4. Add Gender as a report filter 5. Filter the Pivot Table to display only the "Males" in the Management, Marketing, and Production departments. . Question 3: PivotTables and PivotCharts PivotTable 1.0 Using the data below, create a PivotTable on a new sheet called "Ques3A" that displays the average of total salaries, formatted as currency with no decimal places. Use Department as the column labels in the PivotTable and Job Title as the row labels. Then, add Gender as a report filter. 2.0 Edit the "Row Labels" and "Column Labels" entries to display their actual column names. Then, filter the PivotTable to display only the "Males" in the Management, Marketing, and Production departments. PivotChart 3.0 Using the data below, create a new PivotChart on a separate sheet called "Ques3B" that displays a 2D pie chart of the total salaries by Department. Then, add the title "Salary Breakdown by Department" to the chart. 4.0 Add percentage (%) data labels to the outside end of each slice (do not display the dollar values). 0 Education Gender F B.Sc. Given Cheralyn Aaron Kenyon Barbara Connie Year Hired 2003 2002 1988 M B.Com. B.Sc. M 1996 F 1984 F B.Admin. Luce 1996 F F B.Admin. 1992 1981 F 2002 F 1986 F 1 Surname 2Kitching 3 Jaimeson 4 Neumann 5 Kunicki 6 Killian 7 Turgeon 8 Buggey 9 McRae o Alexander 1 Harris 2 Souder 3 Stedman 4 Huber 5 Cortez 6 Bradley 7 Strange 3 Palfrey 9 Hildebrand o Alomar 1 Read 2 Chow Job Title Researcher Clerk Operator Clerk Manager Librarian Salesperson Secretary Manager Researcher Salesperson Salesperson Foreman Controller Accountant Technician Operator Researcher Salesperson Analyst Operator Department |Research Marketing Production Administration Management Administration Marketing Management Administration Research Marketing Marketing Production Finance Finance Research Production Research Marketing Research Production Salary 22,800 21,700 34,900 17,500 37,500 18,500 40,000 24,800 29,000 29,500 34,000 36,000 39,000 54,000 32,000 29,200 34,000 32,000 42,000 16,500 33,700 B.A. B.Sc. B.Com. B.Admin. Diana Gail Mandy Mindy Robyn Simon Tessa Anna Brenda Douglas Ernie Robert Sandra F M M 1999 1997 1979 2001 1995 F F F B.A. F 1997 M 1995 M B.A. M B.A. F B.Com. 1987 1993 2001 1996 Susan F Tina 11 F 10 Q03-01 1. Using the data on Ques3, create a Pivot Table on a new sheet called "Ques3A" that displays the average of total salaries, formatted as currency with no decimals. 2. Use Department as the column labels in the Pivot Table and Job Title as the row labels. 3. Edit the "Row Labels" and "Column Labels" entries to display their actual column names. 4. Add Gender as a report filter 5. Filter the Pivot Table to display only the "Males" in the Management, Marketing, and Production departments. . Question 3: PivotTables and PivotCharts PivotTable 1.0 Using the data below, create a PivotTable on a new sheet called "Ques3A" that displays the average of total salaries, formatted as currency with no decimal places. Use Department as the column labels in the PivotTable and Job Title as the row labels. Then, add Gender as a report filter. 2.0 Edit the "Row Labels" and "Column Labels" entries to display their actual column names. Then, filter the PivotTable to display only the "Males" in the Management, Marketing, and Production departments. PivotChart 3.0 Using the data below, create a new PivotChart on a separate sheet called "Ques3B" that displays a 2D pie chart of the total salaries by Department. Then, add the title "Salary Breakdown by Department" to the chart. 4.0 Add percentage (%) data labels to the outside end of each slice (do not display the dollar values). 0 Education Gender F B.Sc. Given Cheralyn Aaron Kenyon Barbara Connie Year Hired 2003 2002 1988 M B.Com. B.Sc. M 1996 F 1984 F B.Admin. Luce 1996 F F B.Admin. 1992 1981 F 2002 F 1986 F 1 Surname 2Kitching 3 Jaimeson 4 Neumann 5 Kunicki 6 Killian 7 Turgeon 8 Buggey 9 McRae o Alexander 1 Harris 2 Souder 3 Stedman 4 Huber 5 Cortez 6 Bradley 7 Strange 3 Palfrey 9 Hildebrand o Alomar 1 Read 2 Chow Job Title Researcher Clerk Operator Clerk Manager Librarian Salesperson Secretary Manager Researcher Salesperson Salesperson Foreman Controller Accountant Technician Operator Researcher Salesperson Analyst Operator Department |Research Marketing Production Administration Management Administration Marketing Management Administration Research Marketing Marketing Production Finance Finance Research Production Research Marketing Research Production Salary 22,800 21,700 34,900 17,500 37,500 18,500 40,000 24,800 29,000 29,500 34,000 36,000 39,000 54,000 32,000 29,200 34,000 32,000 42,000 16,500 33,700 B.A. B.Sc. B.Com. B.Admin. Diana Gail Mandy Mindy Robyn Simon Tessa Anna Brenda Douglas Ernie Robert Sandra F M M 1999 1997 1979 2001 1995 F F F B.A. F 1997 M 1995 M B.A. M B.A. F B.Com. 1987 1993 2001 1996 Susan F Tina 11 F