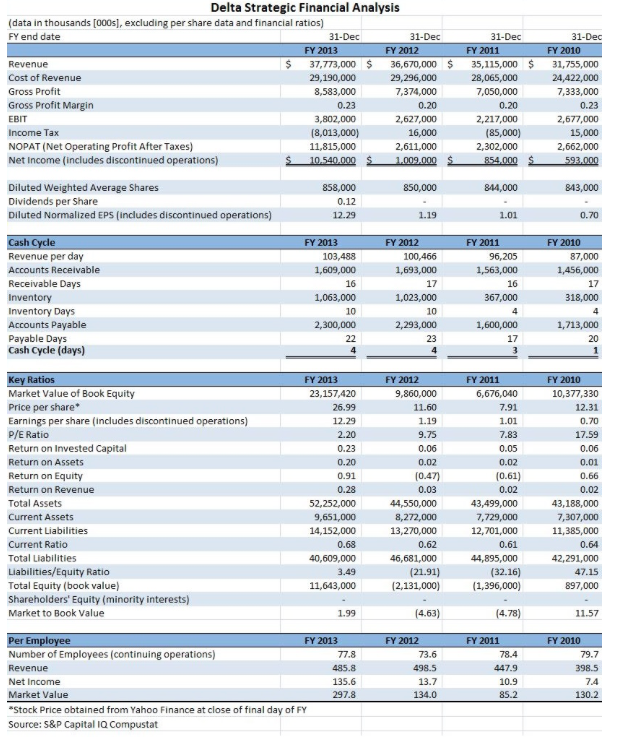
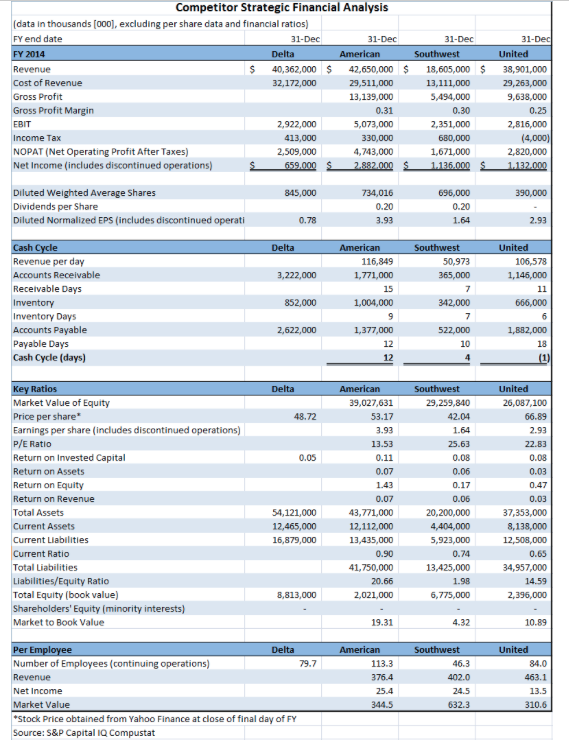
Using the Delta Financial Analysis (FY 2013 FY 2010) and Key Ratio Comparison, calculate the missing values. (Enter your answers in thousands of dollars. Round your answers to 2 decimal place. Omit the "$" & "%" signs in your response.)
| Delta Strategic Financial Analysis |
| (data in thousands [000s], excluding per share data and financial ratios) | | |
| FY end date | | 31-Jan |
| | | FY 2014 |
| Revenue | $ | 40,362,000 |
| Cost of Revenue | | 32,172,000 |
| Gross Profit | | ? |
| Gross Profit Margin | | ? |
| EBIT | | 2,922,000 |
| Income Tax | | 413,000 |
| NOPAT (Net Operating Profit After Taxes) | | 2,509,000 |
| Net Income (includes discontinued operations) | $ | (659,000) |
| | | |
| Diluted Weighted Average Shares | | 845,000 |
| Dividends per Share | | ? |
| Diluted Normalized EPS (includes discontinued operations) | | (0.78) |
| | | |
| Cash Cycle | | FY 2014 |
| Revenue per day | | ? |
| Accounts Receivable | | 3,222,000 |
| Receivable Days | | ? |
| Inventory | | 852,000 |
| Inventory Days | | ? |
| Accounts Payable | | 2,622,000 |
| Payable Days | | ? |
| Cash Cycle (days) | | ? |
| | | |
| Key Ratios | | FY 2014 |
| Market Value of Book Equity | | ? |
| Price per share* | | 48.72 |
| Earnings per share (includes discontinued operations) | | ? |
| P/E Ratio | | ? |
| Return on Invested Capital | | 0.05 |
| Return on Assets | | ? |
| Return on Equity | | ? |
| Return on Revenue | | ? |
| Total Assets | | 54,121,000 |
| Current Assets | | 12,465,000 |
| Current Liabilities | | 16,879,000 |
| Current Ratio | | ? |
| Total Liabilities | | ? |
| Liabilities/Equity Ratio | | ? |
| Total Equity (book value) | | 8,813,000 |
| Shareholders' Equity (minority interests) | | - |
| Market to Book Value | | ? |
| | | |
| Per Employee | | FY 2014 |
| Number of Employees (continuing operations) | | 79.7 |
| Revenue | | ? |
| Net Income | | ? |
| Market Value | | ? |
| |


Delta Strategic Financial Analysis (data in thousands [000s, excluding per share data and financial ratios) FY end date 31-Dec 31-Dec 31-Dec 31-Dec FY 2013 FY 2012 FY 2011 FY 2010 37,773,000 $ 36,670,000 $ Revenue 35,115,000 31,755,000 Cost of Revenue 29,190,000 29,296,000 28,065,000 24,422,000 Gross Profit 7,374,000 7,050,000 7,333,000 8,583,000 Gross Profit Margin 0.23 0.20 0.20 0.23 2,627,000 EBIT 3,802,000 2,217,000 2,677,000 Income Tax (8,013,000) 16,000 (85,000) 15,000 NOPAT (Net Operating Profit After Taxes) Net Income (includes discontinued operations) 2,662,000 11,815,000 2,611,000 2,302,000 10.540.000 $ 854,000 $ 593,000 1,009,000 Diluted Weighted Average Shares 858.000 850,000 844,000 843,000 Dividends per Share Diluted Normalized EPS (includes discontinued operations) 0.12 12.29 1.19 1.01 0.70 Cash Cycle Revenue per day Y 2013 FY 2012 FY 2011 FY 2010 87,000 103.488 100,466 96,205 Accounts Receivable 1,609,000 1,693,000 1,563,000 1,456,000 Receivable Days 16 17 16 17 318.000 Inventory Inventory Days 1,063,000 1,023,000 367,000 10 10 4 Accounts Payable Payable Days Cash Cycle (days) 2,300,000 2,293,000 1,600,000 1,713,000 22 23 17 20 4 4 Key Ratios Market Value of Book Equity Price per share FY 2013 FY 2012 FY 2011 FY 2010 6,676,040 23.157.420 9,860,000 10,377,330 26.99 11.60 7.91 12.31 Earnings per share (includes discontinued operations) P/E Ratio 1.19 1.01 0.70 12.29 2.20 9.75 7.83 17.59 Return on Invested Capital 0.23 0.06 0.05 0.06 Return on Assets 0.20 0.02 0.02 0.01 Return on Equity 0.91 (0.47) (0.61) 0.66 Return on Revenue 0.28 0.03 0.02 0.02 Total Assets 52,252.000 44,550,000 43,499,000 43,188,000 9,651,000 14,152,000 7,729,000 7,307,000 Current Assets 8,272,000 Current Liabilities 13,270,000 12,701,000 11,385,000 Current Ratio 0.68 0.62. 0.61 0.64 Total Liabilities 42,291.000 40,609,000 46,681,000 44,895,000 Liabilities/Equity Ratio 3,49 (21.91) (32.16) 47.15 Total Equity (book value) Shareholders' Equity (minority interests) 11,643,000 (2,131,000) (1,396,000) 897,000 Market to Book Value (4.63) (4.78) 11.57 1.99 Per Employee Number of Employees (continuing operations) FY 2013 FY 2012 FY 2011 FY 2010 77.8 73.6 78.4 79.7 Revenue 485.8 498.5 447.9 398.5 Net Income 135.6 13.7 10.9 7,4 Market Value 297.8 134.0 85.2 130.2 Stock Price obtained from Yahoo Finance at close of final day of FY Source: 5&P Capital IQ Compustat 8 Competitor Strategic Financial Analysis (data in thousands [000], excluding per share data and financial ratios) 31-Dec FY end date 31-Dec 31-Dec 31-Dec Delta American Southwest United FY 2014 Revenue 40,362,000 $ 42,650,000 $ 18,605,000 $ 38,901,000 Cost of Revenue 29,511,000 29,263,000 32,172,000 13,111,000 Gross Profit 13,139,000 9,638,000 5,494,000 Gross Profit Margin 0.31 0.30 0.25 2,816,000 EBIT 2,922,000 5,073,000 2,351,000 (4,000) Income Tax 413,000 330,000 680,000 NOPAT (Net Operating Profit After Taxes) 2,509,000 4,743,000 1,671,000 2,820,000 Net Income (includes discontinued operations) 659.000 $ 2.882.000 $ 1.136.000 S 1.132.000 Diluted Weighted Average Shares 845,000 734,016 696,000 390,000 Dividends per Share Diluted Normalized EPS (includes discontinued operati 0.20 0.20 0.78 3.93 1.64 2.93 Cash Cycle Delta American Southwest United Revenue per day 116.849 50,973 106,578 Accounts Receivable 3,222.000 1,771,000 365,000 1,146,000 Receivable Days 15 7 11 Inventory Inventory Days 852,000 1,004,000 342,000 666,000 6 9 7 Accounts Payable 2,622,000 1,377,000 522,000 1,882,000 Payable Days 10 12 18 Cash Cycle (days) (1) 12 4 Key Ratios Market Value of Equity American Delta Southwest United 39,027,631 29,259,840 26,087,100 Price per share 48.72 53.17 42.04 66.89 Earnings per share (includes discontinued operations) 3.93 1.64 2.93 P/E Ratio 13.53 25.63 22.83 Return on Invested Capital 0.05 0.11 0.08 0.08 Return on Assets 0.07 0.06 0.03 Return on Equity 143 0.17 0.47 Return on Revenue 0.07 0.06 0.03 Total Assets 54,121,000 43,771,000 20,200,000 37,353,000 Current Assets 12.465,000 12,112.000 4,404,000 8,138,000 Current Liabilities 16,879,000 13,435,000 5,923,000 12,508,000 Current Ratio 0.90 0.74 0.65 13.425,000 Total Liabilities 41,750,000 34,957,000 Liabilities/Equity Ratio 1.98 14.59 20.66 Total Equity (book value) 8,813,000 2,021,000 6,775,000 2,396,000 Shareholders' Equity (minority interests) Market to Book Value 19.31 4.32 10.89 Per Employee Number of Employees (continuing operations) Delta American Southwest United 79.7 113.3 46.3 84.0 Revenue 376.4 402.0 463.1 Net Income 25.4 24.5 13.5 Market Value 344.5 632.3 310.6 *Stock Price obtained from Yahoo Finance at close of final day of FY Source: S&P Capital IQ Compustat Delta Strategic Financial Analysis (data in thousands [000s, excluding per share data and financial ratios) FY end date 31-Dec 31-Dec 31-Dec 31-Dec FY 2013 FY 2012 FY 2011 FY 2010 37,773,000 $ 36,670,000 $ Revenue 35,115,000 31,755,000 Cost of Revenue 29,190,000 29,296,000 28,065,000 24,422,000 Gross Profit 7,374,000 7,050,000 7,333,000 8,583,000 Gross Profit Margin 0.23 0.20 0.20 0.23 2,627,000 EBIT 3,802,000 2,217,000 2,677,000 Income Tax (8,013,000) 16,000 (85,000) 15,000 NOPAT (Net Operating Profit After Taxes) Net Income (includes discontinued operations) 2,662,000 11,815,000 2,611,000 2,302,000 10.540.000 $ 854,000 $ 593,000 1,009,000 Diluted Weighted Average Shares 858.000 850,000 844,000 843,000 Dividends per Share Diluted Normalized EPS (includes discontinued operations) 0.12 12.29 1.19 1.01 0.70 Cash Cycle Revenue per day Y 2013 FY 2012 FY 2011 FY 2010 87,000 103.488 100,466 96,205 Accounts Receivable 1,609,000 1,693,000 1,563,000 1,456,000 Receivable Days 16 17 16 17 318.000 Inventory Inventory Days 1,063,000 1,023,000 367,000 10 10 4 Accounts Payable Payable Days Cash Cycle (days) 2,300,000 2,293,000 1,600,000 1,713,000 22 23 17 20 4 4 Key Ratios Market Value of Book Equity Price per share FY 2013 FY 2012 FY 2011 FY 2010 6,676,040 23.157.420 9,860,000 10,377,330 26.99 11.60 7.91 12.31 Earnings per share (includes discontinued operations) P/E Ratio 1.19 1.01 0.70 12.29 2.20 9.75 7.83 17.59 Return on Invested Capital 0.23 0.06 0.05 0.06 Return on Assets 0.20 0.02 0.02 0.01 Return on Equity 0.91 (0.47) (0.61) 0.66 Return on Revenue 0.28 0.03 0.02 0.02 Total Assets 52,252.000 44,550,000 43,499,000 43,188,000 9,651,000 14,152,000 7,729,000 7,307,000 Current Assets 8,272,000 Current Liabilities 13,270,000 12,701,000 11,385,000 Current Ratio 0.68 0.62. 0.61 0.64 Total Liabilities 42,291.000 40,609,000 46,681,000 44,895,000 Liabilities/Equity Ratio 3,49 (21.91) (32.16) 47.15 Total Equity (book value) Shareholders' Equity (minority interests) 11,643,000 (2,131,000) (1,396,000) 897,000 Market to Book Value (4.63) (4.78) 11.57 1.99 Per Employee Number of Employees (continuing operations) FY 2013 FY 2012 FY 2011 FY 2010 77.8 73.6 78.4 79.7 Revenue 485.8 498.5 447.9 398.5 Net Income 135.6 13.7 10.9 7,4 Market Value 297.8 134.0 85.2 130.2 Stock Price obtained from Yahoo Finance at close of final day of FY Source: 5&P Capital IQ Compustat 8 Competitor Strategic Financial Analysis (data in thousands [000], excluding per share data and financial ratios) 31-Dec FY end date 31-Dec 31-Dec 31-Dec Delta American Southwest United FY 2014 Revenue 40,362,000 $ 42,650,000 $ 18,605,000 $ 38,901,000 Cost of Revenue 29,511,000 29,263,000 32,172,000 13,111,000 Gross Profit 13,139,000 9,638,000 5,494,000 Gross Profit Margin 0.31 0.30 0.25 2,816,000 EBIT 2,922,000 5,073,000 2,351,000 (4,000) Income Tax 413,000 330,000 680,000 NOPAT (Net Operating Profit After Taxes) 2,509,000 4,743,000 1,671,000 2,820,000 Net Income (includes discontinued operations) 659.000 $ 2.882.000 $ 1.136.000 S 1.132.000 Diluted Weighted Average Shares 845,000 734,016 696,000 390,000 Dividends per Share Diluted Normalized EPS (includes discontinued operati 0.20 0.20 0.78 3.93 1.64 2.93 Cash Cycle Delta American Southwest United Revenue per day 116.849 50,973 106,578 Accounts Receivable 3,222.000 1,771,000 365,000 1,146,000 Receivable Days 15 7 11 Inventory Inventory Days 852,000 1,004,000 342,000 666,000 6 9 7 Accounts Payable 2,622,000 1,377,000 522,000 1,882,000 Payable Days 10 12 18 Cash Cycle (days) (1) 12 4 Key Ratios Market Value of Equity American Delta Southwest United 39,027,631 29,259,840 26,087,100 Price per share 48.72 53.17 42.04 66.89 Earnings per share (includes discontinued operations) 3.93 1.64 2.93 P/E Ratio 13.53 25.63 22.83 Return on Invested Capital 0.05 0.11 0.08 0.08 Return on Assets 0.07 0.06 0.03 Return on Equity 143 0.17 0.47 Return on Revenue 0.07 0.06 0.03 Total Assets 54,121,000 43,771,000 20,200,000 37,353,000 Current Assets 12.465,000 12,112.000 4,404,000 8,138,000 Current Liabilities 16,879,000 13,435,000 5,923,000 12,508,000 Current Ratio 0.90 0.74 0.65 13.425,000 Total Liabilities 41,750,000 34,957,000 Liabilities/Equity Ratio 1.98 14.59 20.66 Total Equity (book value) 8,813,000 2,021,000 6,775,000 2,396,000 Shareholders' Equity (minority interests) Market to Book Value 19.31 4.32 10.89 Per Employee Number of Employees (continuing operations) Delta American Southwest United 79.7 113.3 46.3 84.0 Revenue 376.4 402.0 463.1 Net Income 25.4 24.5 13.5 Market Value 344.5 632.3 310.6 *Stock Price obtained from Yahoo Finance at close of final day of FY Source: S&P Capital IQ Compustat


