Question
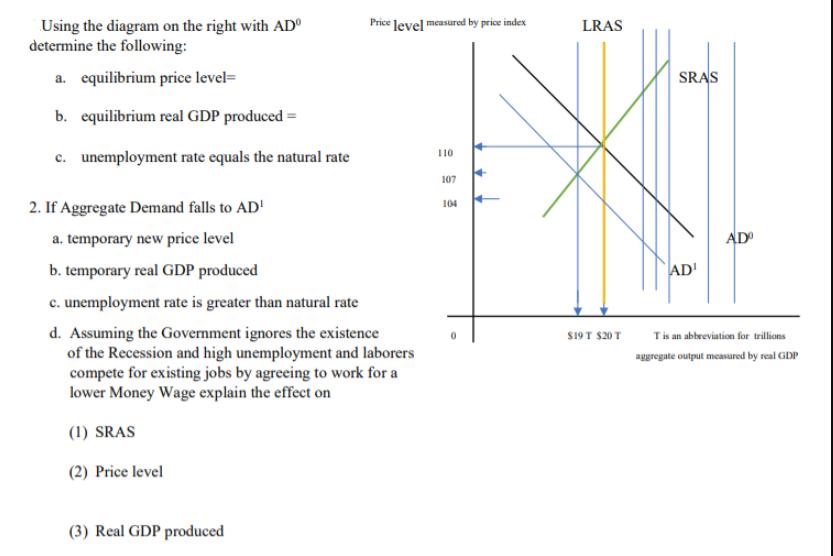
Using the diagram on the right with AD determine the following: a. equilibrium price level= b. equilibrium real GDP produced= c. unemployment rate equals

Using the diagram on the right with AD determine the following: a. equilibrium price level= b. equilibrium real GDP produced= c. unemployment rate equals the natural rate Price level measured by price index 2. If Aggregate Demand falls to AD a. temporary new price level b. temporary real GDP produced c. unemployment rate is greater than natural rate d. Assuming the Government ignores the existence of the Recession and high unemployment and laborers compete for existing jobs by agreeing to work for a lower Money Wage explain the effect on (1) SRAS (2) Price level (3) Real GDP produced 110 107 104 0 LRAS $19 T $20 T SRAS AD AD T is an abbreviation for trillions aggregate output measured by real GDP
Step by Step Solution
3.45 Rating (148 Votes )
There are 3 Steps involved in it
Step: 1

Get Instant Access to Expert-Tailored Solutions
See step-by-step solutions with expert insights and AI powered tools for academic success
Step: 2

Step: 3

Ace Your Homework with AI
Get the answers you need in no time with our AI-driven, step-by-step assistance
Get StartedRecommended Textbook for
Macroeconomics
Authors: Robert J Gordon
12th edition
138014914, 978-0138014919
Students also viewed these Economics questions
Question
Answered: 1 week ago
Question
Answered: 1 week ago
Question
Answered: 1 week ago
Question
Answered: 1 week ago
Question
Answered: 1 week ago
Question
Answered: 1 week ago
Question
Answered: 1 week ago
Question
Answered: 1 week ago
Question
Answered: 1 week ago
Question
Answered: 1 week ago
Question
Answered: 1 week ago
Question
Answered: 1 week ago
Question
Answered: 1 week ago
Question
Answered: 1 week ago
Question
Answered: 1 week ago
Question
Answered: 1 week ago
Question
Answered: 1 week ago
Question
Answered: 1 week ago
Question
Answered: 1 week ago
Question
Answered: 1 week ago
Question
Answered: 1 week ago
View Answer in SolutionInn App


