Using the equation = 2.6 - 3.1x, what is the predicted value if x is 4.3? (4 points)
-10.73
10.73
15.93
-15.93
0.54
-------------------------------------------
The regression equation for change in temperature, y, to amount of humidity in percent, h, is given by = 9.1 + 0.6h. On Sunday, the observed amount of humidity was 23 percent and the temperature change was 20.7 degrees. Find and interpret the residual. (4 points)
-2.2. The regression line overpredicts the temperature change.
2.2. The regression line underpredicts the temperature change.
43.6. The regression line overpredicts the temperature change.
-43.6. The regression line underpredicts the temperature change.
19.3. The regression line underpredicts the temperature change.
-----------------------------------------------------
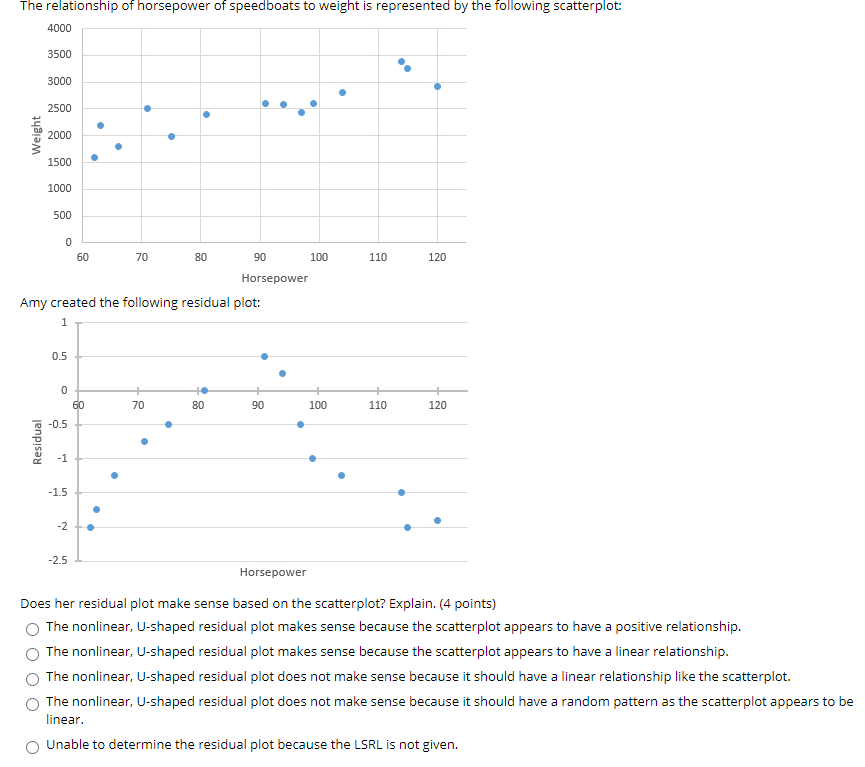
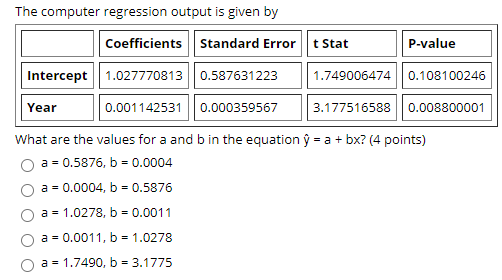
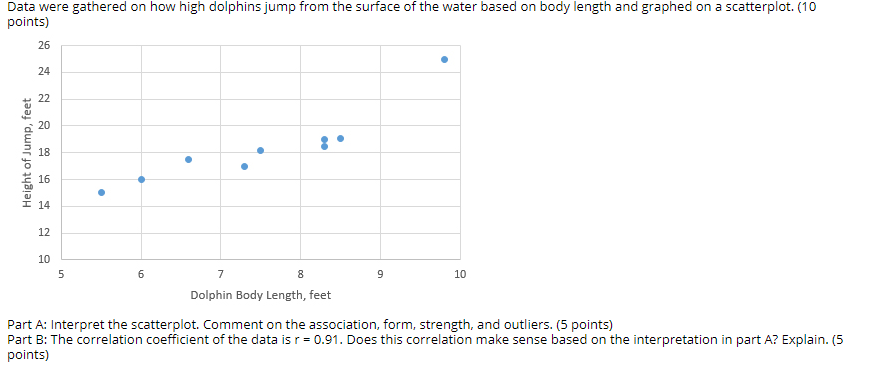
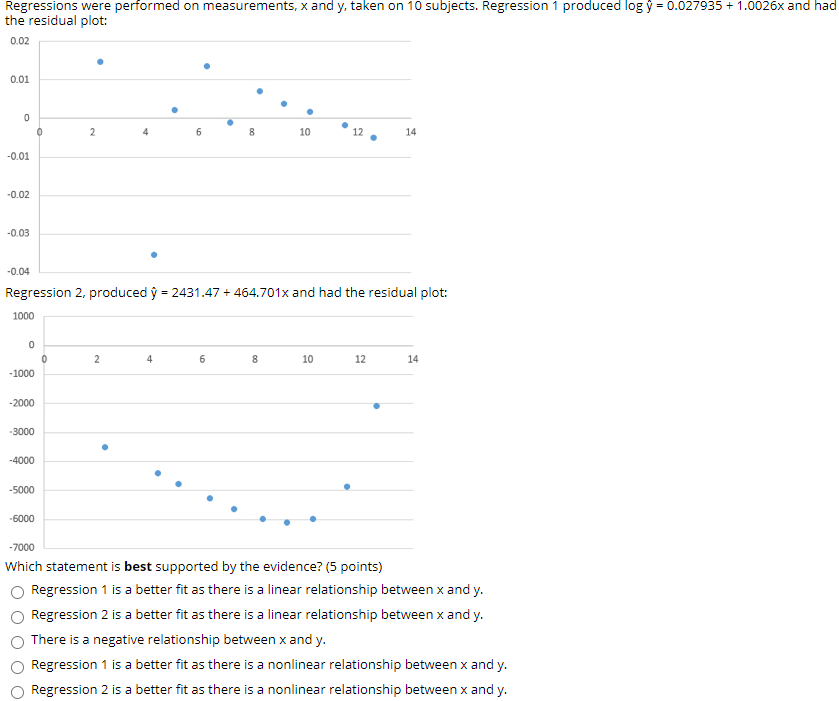
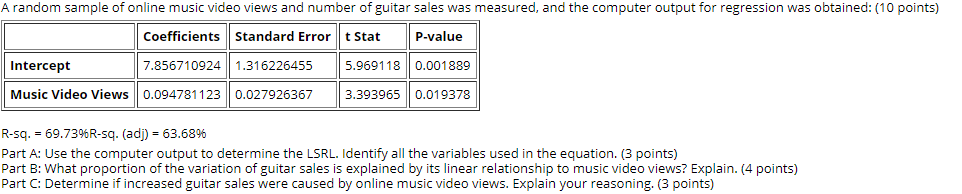
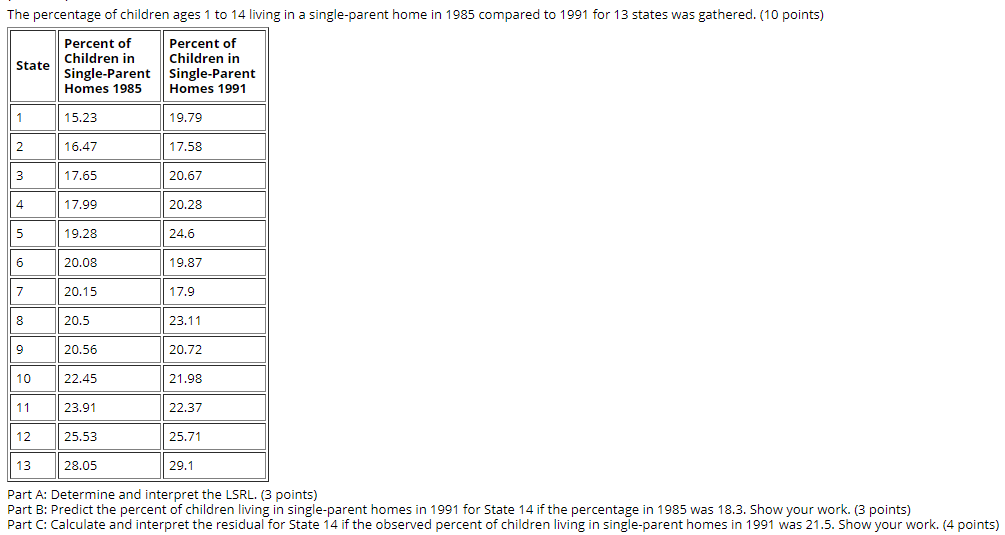
The relationship of horsepower of speed boats to weight is represented by the following scatterplot: 4000 3500 3000 O. O 2500 o . 2000 0 Weight 0 1500 ' 1000 500 60 TD 30 SI] 11]] 11!] 120 Horsepower Amy created the following residual plot: 1 Horsepower Does her residual plot make sense based on the scatterplot? Explain. [4 points} 0 The nonlinear. U-shaped residual plot makes sense because the scatterplot appears to have a positive relationship. 0 The nonlinear. U-shaped residual plot makes sense because the scatterplot appears to have a linear relationship. O The nonlinear. U-shaped residual plot does not make sense because it should have a linear relationship like the scatterplot. O The nonlinear. Ushaped residual plot does not make sense because it should have a random pattern as the scatterplot appears to be linear. 0 Unable to determine the residual plot because the URL is not given. The computer regression output is given by Coefficients Standard Error t Stat P-value Intercept 1.027770813 0.587631223 1.749006474 0.108100246 Year 0.001 142531 0.000359567 3.177516588 0.008800001 What are the values for a and b in the equation y = a + bx? (4 points) O a = 0.5876, b = 0.0004 O a = 0.0004, b = 0.5876 a = 1.0278, b = 0.0011 O a = 0.0011, b = 1.0278 a = 1.7490, b = 3.1775Data were gathered on how high dolphins jump from the surface of the water based on body length and graphed on a scatterplot. (10 points) 26 24 Height of Jump, feet 22 20 18 . 16 14 12 10 5 6 7 8 9 10 Dolphin Body Length, feet Part A: Interpret the scatterplot. Comment on the association, form, strength, and outliers. (5 points) Part B: The correlation coefficient of the data is r = 0.91. Does this correlation make sense based on the interpretation in part A? Explain. (5 points)Regressions were performed on measurements, x and 3.: taken on 10 subjects. Regression 1 produced log 5' = 0.03935 + 1.0026}: and had the residual plot: I102 [[01 4101 43.02 4103 {104 Regression 2. produced [Ir = 2431.4? + 464.?D1x and had the residual plot: 1000 -JU I . I #000 Which statement is best supported by the evidence? {5 points} 0 Regression 1 is a better t as there is a linear relationship between x and y. 0 Regression 2 is a better t as there is a linear relationship between x and y. 0 There is a negative relationship between K and y. 0 Regression 1 is a better t as there is a nonlinear relationship between x and y. 0 Regression 2 is a better t as there is a nonlinear relationship between K and y. A random sample of online music video views and number of guitar sales was measured, and the computer output for regression was obtained: (10 points) Coefficients Standard Error t Stat P-value Intercept 7.856710924 1.316226455 5.9691 18 0.001889 Music Video Views 0.094781123 0.027926367 3.393965 0.019378 R-sq. = 69.739%R-sq. (adj) = 63.689% Part A: Use the computer output to determine the LSRL. Identify all the variables used in the equation. (3 points) Part B: What proportion of the variation of guitar sales is explained by its linear relationship to music video views? Explain. (4 points) Part C: Determine if increased guitar sales were caused by online music video views. Explain your reasoning. (3 points)"he percentage of children ages 1 to 14 living in a single-parent home in 1985 compared to 1991 for 13 states was gathered. (10 points] Percent of Percent of Children in Children in Single-Pa rent Single-Pa rent Homes 1985 Homes 1991 State 1 l 15.23 19.?9 2 I 16.4? 1?.58 3 20.5? 20. 28 l 1? 65 1?.99 5 l 19.28 24.6 I 20.08 I 2015 : 6 19.8? ? 1?.9 8 20.5 23.11 9 l 20.56 20.?2 10 l 22.45- 21.98 11 l 23.91 22.3? 12 25.53 25.?1 13 l 28.05- 29.1 Part A: Determine and interpret the LSRL. (3 points) Part B: Predict the percent ofchildren living in singleparent homes in 1991 for State 14 if the percentage in 1985 was 18.3. Show your work. (3 points] Part C: Calculate and interpret the residual for State 14 ifthe observed percent of children living in single-parent homes in 1991 was 21.5. Show your work. (4 points)