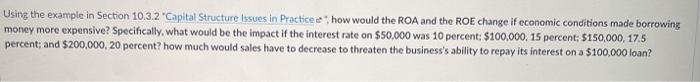
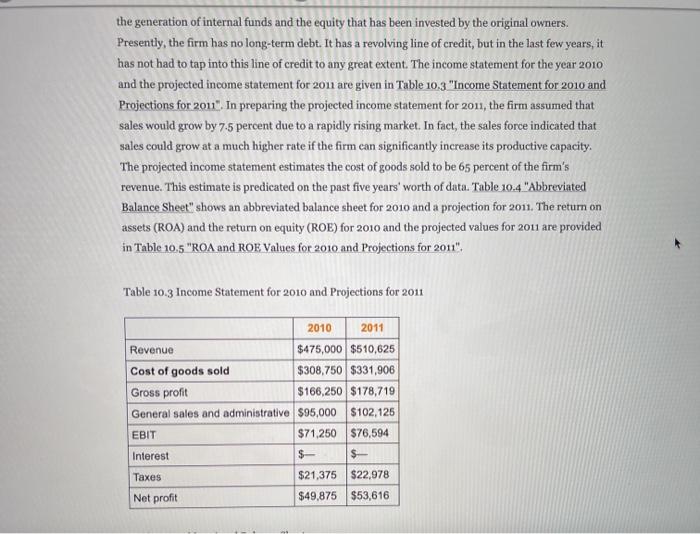
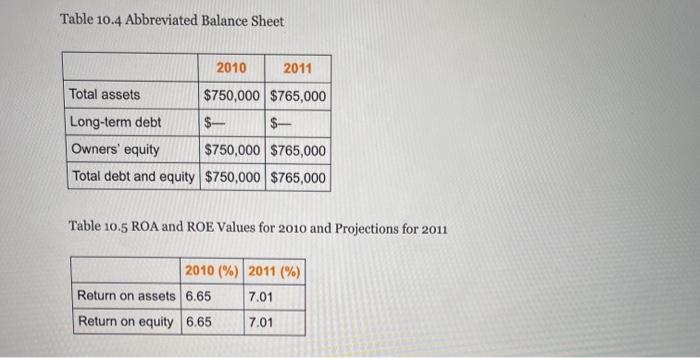
Using the example in Section 10.3.2 "Capital Structure issues in Practice how would the ROA and the ROE change if economic conditions made borrowing money more expensive? Specifically, what would be the impact if the interest rate on $50,000 was 10 percent: $100,000, 15 percent: $150,000, 17.5 percent; and $200,000, 20 percent? how much would sales have to decrease to threaten the business's ability to repay its interest on a $100,000 loan? Capital Structure issues in Practice In Section 10.2 "Financial Control", the need to balance debt and equity, with respect to financing a firm's operations, is briefly discussed. A critical financial decision for any business owner is determining the extent of financial leverage a firm should acquire. Building a firm using debt amplifies a return of equity to the owners; however, the acquisition of too much debt, which cannot be repaid, may lead to a Chapter 1 "Foundations for Small Business" bankruptcy, which represents a complete failure of the firm. In the early 1950s, the field of finance tried to describe the effect of financial leverage on the valuation of a firm and its cost of capital.David Durand, "Cost of Debt and Equity Funds for Business: Trends and Problems of Measurement, " Conference on Research in Business Finance (New York: National Bureau of Economic Research, 1952), 220. A major breakthrough occurred with the works of Franco Modigliani and Merton Miler Franco Modigliani and Merton Miller, "The Cost of Capital, Corporation Finance and the Theory of Investment," American Economic Review 48, no. 3 (1958): 261-97; Franco Modigliani and Merton Miller, "Taxes and the cost of Capital: A Correction" American Economic Review 53 (1963): 433-43. Reduced to simplest form, their works hypothesized that the valuation of a firm increases as the financial leverage increases. This is true but only up to a point. When a firm exceeds a particular value of financial leverage-namely, it has assumed too much debt-the overall value of the firm begins to decline. The point at which the valuation of a firm is maximized determines the optimal capital structure of the business. The model defined valuation as a firm's earnings before interest and taxes (EBIT) divided by its cost of capital. Cost of capital is a weighted average of a firm's debt and equity, where equity directly relates to a firm's stock. The reality is that this model is far more closely attuned, from a mathematical standpoint, to the corporate entity. It cannot be directly applied to most small businesses. However, the basic notion that there is some desired level of dat tenni a law that vields maximum namic benefit is sermane, as we will the generation of internal funds and the equity that has been invested by the original owners. Presently, the firm has no long-term debt. It has a revolving line of credit, but in the last few years, it has not had to tap into this line of credit to any great extent. The income statement for the year 2010 and the projected income statement for 2011 are given in Table 10,3 "Income Statement for 2010 and Projections for 2011". In preparing the projected income statement for 2011, the firm assumed that sales would grow by 7.5 percent due to a rapidly rising market. In fact, the sales force indicated that sales could grow at a much higher rate if the firm can significantly increase its productive capacity. The projected income statement estimates the cost of goods sold to be 65 percent of the firm's revenue. This estimate is predicated on the past five years' worth of data. Table 10.4 "Abbreviated Balance Sheet" shows an abbreviated balance sheet for 2010 and a projection for 2011. The retum on assets (ROA) and the return on equity (ROE) for 2010 and the projected values for 20u are provided in Table 10,5 "ROA and ROE Values for 2010 and Projections for 2011". Table 10-3 Income Statement for 2010 and Projections for 2011 2010 2011 Revenue $475,000 $510,625 Cost of goods sold $308,750 $331,906 Gross profit $166,250 $178,719 General sales and administrative $95,000 $102,125 EBIT $71,250 $76,594 Interest $ $ Taxes $21,375 $22,978 Net profit $49,875 $53,616 Table 10.4 Abbreviated Balance Sheet 2010 2011 Total assets $750,000 $765,000 Long-term debt $- $- Owners' equity $750,000 $765,000 Total debt and equity $750,000 $765,000 Table 10.5 ROA and ROE Values for 2010 and Projections for 2011 2010 (%) 2011 (%) Return on assets 6.65 7.01 Return on equity 6.65 7.01 Using the example in Section 10.3.2 "Capital Structure issues in Practice how would the ROA and the ROE change if economic conditions made borrowing money more expensive? Specifically, what would be the impact if the interest rate on $50,000 was 10 percent: $100,000, 15 percent: $150,000, 17.5 percent; and $200,000, 20 percent? how much would sales have to decrease to threaten the business's ability to repay its interest on a $100,000 loan? Capital Structure issues in Practice In Section 10.2 "Financial Control", the need to balance debt and equity, with respect to financing a firm's operations, is briefly discussed. A critical financial decision for any business owner is determining the extent of financial leverage a firm should acquire. Building a firm using debt amplifies a return of equity to the owners; however, the acquisition of too much debt, which cannot be repaid, may lead to a Chapter 1 "Foundations for Small Business" bankruptcy, which represents a complete failure of the firm. In the early 1950s, the field of finance tried to describe the effect of financial leverage on the valuation of a firm and its cost of capital.David Durand, "Cost of Debt and Equity Funds for Business: Trends and Problems of Measurement, " Conference on Research in Business Finance (New York: National Bureau of Economic Research, 1952), 220. A major breakthrough occurred with the works of Franco Modigliani and Merton Miler Franco Modigliani and Merton Miller, "The Cost of Capital, Corporation Finance and the Theory of Investment," American Economic Review 48, no. 3 (1958): 261-97; Franco Modigliani and Merton Miller, "Taxes and the cost of Capital: A Correction" American Economic Review 53 (1963): 433-43. Reduced to simplest form, their works hypothesized that the valuation of a firm increases as the financial leverage increases. This is true but only up to a point. When a firm exceeds a particular value of financial leverage-namely, it has assumed too much debt-the overall value of the firm begins to decline. The point at which the valuation of a firm is maximized determines the optimal capital structure of the business. The model defined valuation as a firm's earnings before interest and taxes (EBIT) divided by its cost of capital. Cost of capital is a weighted average of a firm's debt and equity, where equity directly relates to a firm's stock. The reality is that this model is far more closely attuned, from a mathematical standpoint, to the corporate entity. It cannot be directly applied to most small businesses. However, the basic notion that there is some desired level of dat tenni a law that vields maximum namic benefit is sermane, as we will the generation of internal funds and the equity that has been invested by the original owners. Presently, the firm has no long-term debt. It has a revolving line of credit, but in the last few years, it has not had to tap into this line of credit to any great extent. The income statement for the year 2010 and the projected income statement for 2011 are given in Table 10,3 "Income Statement for 2010 and Projections for 2011". In preparing the projected income statement for 2011, the firm assumed that sales would grow by 7.5 percent due to a rapidly rising market. In fact, the sales force indicated that sales could grow at a much higher rate if the firm can significantly increase its productive capacity. The projected income statement estimates the cost of goods sold to be 65 percent of the firm's revenue. This estimate is predicated on the past five years' worth of data. Table 10.4 "Abbreviated Balance Sheet" shows an abbreviated balance sheet for 2010 and a projection for 2011. The retum on assets (ROA) and the return on equity (ROE) for 2010 and the projected values for 20u are provided in Table 10,5 "ROA and ROE Values for 2010 and Projections for 2011". Table 10-3 Income Statement for 2010 and Projections for 2011 2010 2011 Revenue $475,000 $510,625 Cost of goods sold $308,750 $331,906 Gross profit $166,250 $178,719 General sales and administrative $95,000 $102,125 EBIT $71,250 $76,594 Interest $ $ Taxes $21,375 $22,978 Net profit $49,875 $53,616 Table 10.4 Abbreviated Balance Sheet 2010 2011 Total assets $750,000 $765,000 Long-term debt $- $- Owners' equity $750,000 $765,000 Total debt and equity $750,000 $765,000 Table 10.5 ROA and ROE Values for 2010 and Projections for 2011 2010 (%) 2011 (%) Return on assets 6.65 7.01 Return on equity 6.65 7.01