

Answered step by step
Verified Expert Solution
Question
1 Approved Answer
Using the financial statements for the Hayden Manufacturing Company, please create a working spreadsheet of the statements and, for both 2020 and 2019, calculate each
Using the financial statements for the Hayden Manufacturing Company, please create a working spreadsheet of the statements and, for both 2020 and 2019, calculate each of the ratios covered in the Financial Analysis modules. If numbers can be created from the statements, make them working parts of the spreadsheet, dont just type them into the spreadsheet. 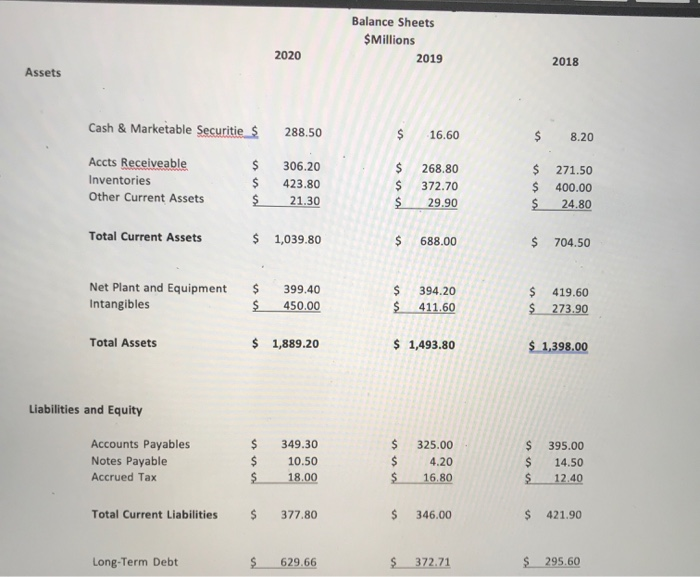
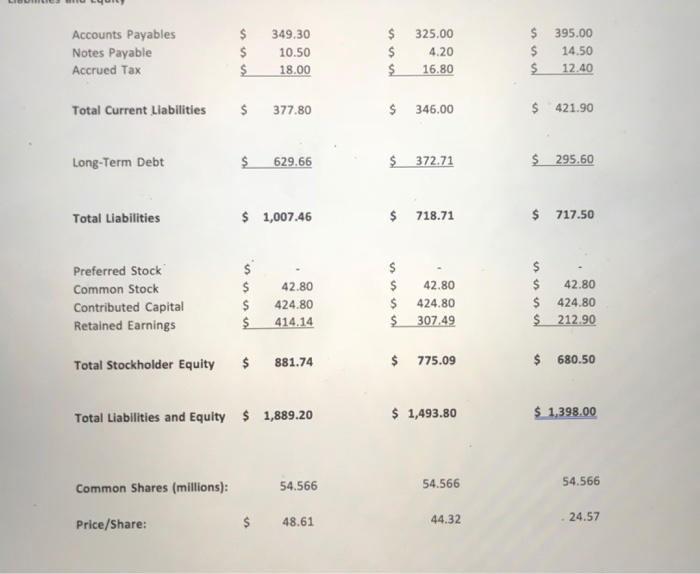
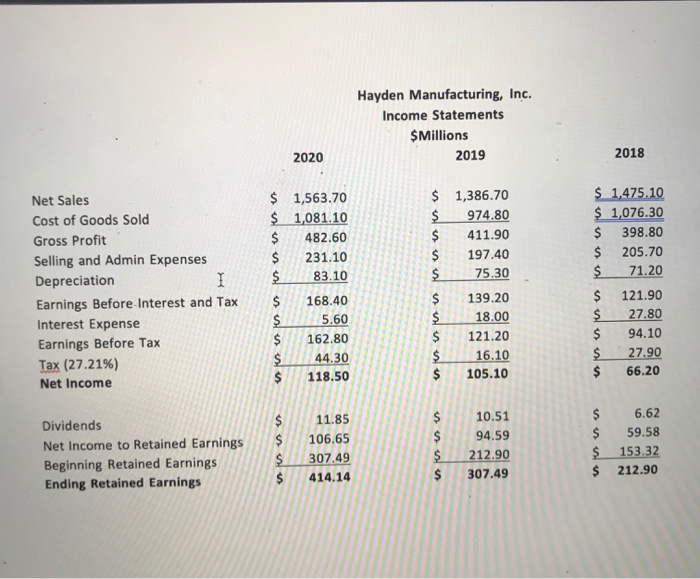
Balance Sheets $Millions 2019 2020 2018 Assets Cash & Marketable Securities 288.50 $ 16.60 8.20 $ Accts Receiveable Inventories Other Current Assets $ $ $ 306.20 423.80 21.30 $ $ 268.80 372.70 29.90 $ 271.50 $ 400.00 $ 24.80 Total Current Assets $ 1,039.80 $ 688.00 $ 704.50 Net Plant and Equipment Intangibles $ $ 399.40 450.00 $ $ $ 394.20 411.60 419.60 $ 273.90 Total Assets $ 1,889.20 $ 1,493.80 $ 1,398.00 Liabilities and Equity Accounts Payables Notes Payable Accrued Tax 349.30 10.50 18.00 $ $ $ $ 325.00 4.20 16.80 $ $ 395.00 14.50 12.40 Total Current Liabilities $ 377.80 346.00 421.90 Long-Term Debt $ 629.66 $ 372.71 $ 295.60 $ Accounts Payables Notes Payable Accrued Tax S $ $ 349.30 10.50 18.00 is 325.00 4.20 16.80 $ $ $ 395.00 14.50 12.40 $ Total Current Liabilities $ 377.80 $ 346.00 $ 421.90 Long-Term Debt $ 629.66 $ 372.71 $ 295.60 Total Liabilities $ 1,007.46 $ 718.71 $ 717.50 $ Preferred Stock Common Stock Contributed Capital Retained Earnings $ $ $ $ 42.80 424.80 414.14 $ $ 42.80 $ 424.80 $ 307,49 $ 42.80 $ 424.80 $ 212.90 Total Stockholder Equity $ 881.74 $ 775.09 $ 680.50 Total Liabilities and Equity $ 1,889.20 $ 1,493.80 $ 1,398.00 54.566 Common Shares (millions): 54.566 54.566 Price/Share: 24.57 $ 48.61 44.32 Hayden Manufacturing, Inc. Income Statements $Millions 2019 2020 2018 $ $ 1,563.70 $ 1,081.10 $ 482.60 $ 231.10 $ 83.10 $ 1,386.70 974.80 $ 411.90 197.40 75.30 $ $ Net Sales Cost of Goods Sold Gross Profit Selling and Admin Expenses Depreciation I Earnings Before Interest and Tax Interest Expense Earnings Before Tax Tax (27.21%) Net Income $ 1,475.10 $ 1,076.30 $ 398.80 $ 205.70 $ 71.20 $ 121.90 $ 27.80 94.10 $ 27.90 $ 66.20 168.40 $ 5.60 $ is $ $ $ $ $ $ 162.80 44.30 118.50 139.20 18.00 121.20 16.10 105.10 $ $ $ Dividends Net Income to Retained Earnings Beginning Retained Earnings Ending Retained Earnings $ $ $ $ 11.85 106.65 307.49 414.14 10.51 94.59 212.90 307.49 $ 6.62 $ 59.58 $ 153.32 $ 212.90 $ $ Step by Step Solution
There are 3 Steps involved in it
Step: 1

Get Instant Access to Expert-Tailored Solutions
See step-by-step solutions with expert insights and AI powered tools for academic success
Step: 2

Step: 3
Ace Your Homework with AI
Get the answers you need in no time with our AI-driven, step-by-step assistance
Get Started
Finance And Strategy Inside China
Authors: Check-Teck Foo
1st Edition
9811328404,9811328412