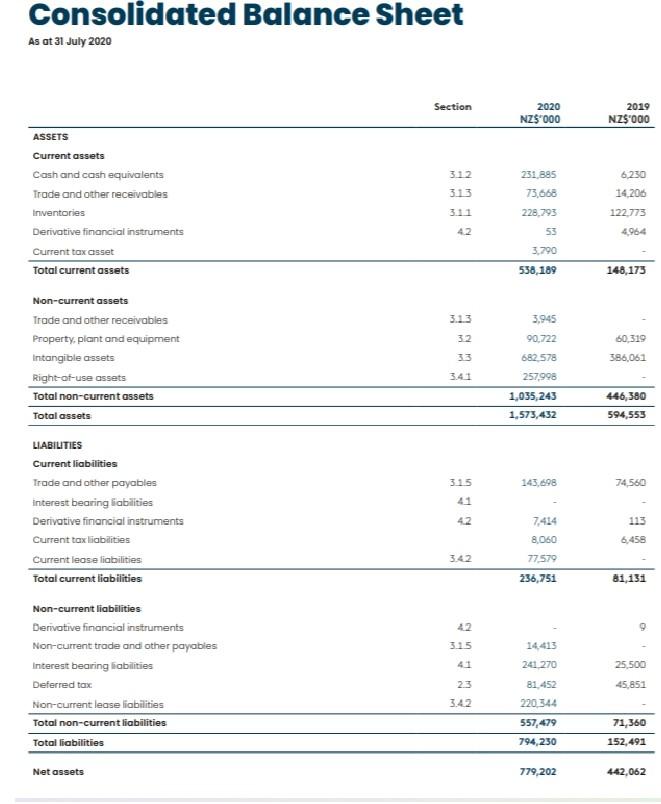
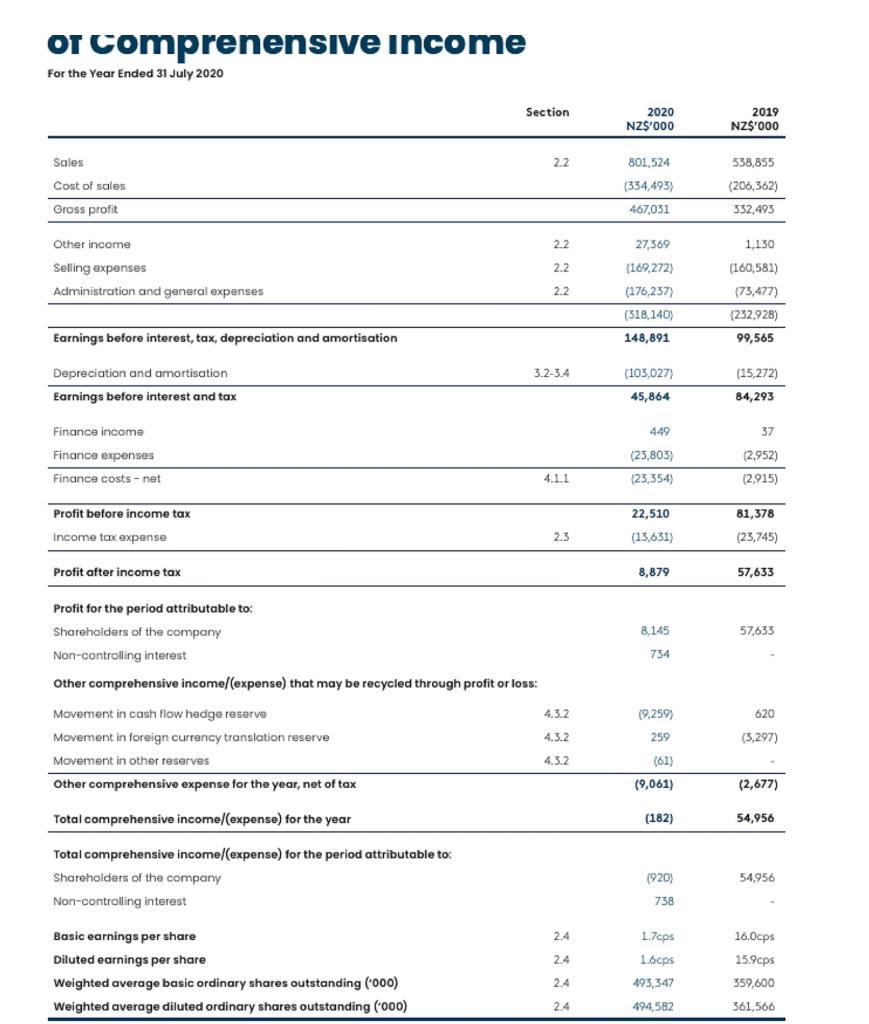
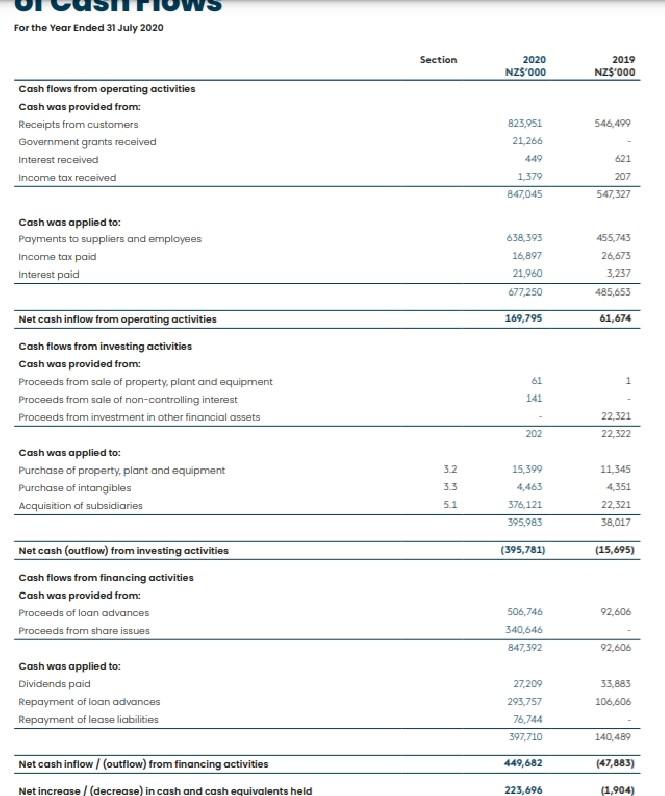
Using the financial statements from the most recent annual report for Kathmandu or Super Retail Group, update the calculation of ratios found in this chapter. Compare the ratios to the ones calculated in this chapter, and comment on the four key aspects of its financial performance: profitability, operating management, investment management and financial management. Using the sustainable growth rate calculated in this chapter, how indicative of Kathmandu or Super Retails growth to date has that ratio been?


Consolidated Balance Sheet As at 31 July 2020 Section 2020 NZS000 2019 NZ$000 ASSETS Current assets Cash and cash equivalents Trade and other receivables 3.12 6230 3.13 14,206 122.773 Inventories 231.885 73.668 228.793 53 3.790 538, 189 42 4,964 Derivative financial instruments Current tax asset Total current assets 148,173 3.13 32 Non-current assets Trade and other receivables Property, plant and equipment Intangible assets Right-of-use assets Total non-current assets 3,945 90.722 682578 60,519 386,061 257,998 1,035,243 1,573,432 446,580 594,553 Total assets 3.15 145.698 74.560 41 42 113 6.458 3.42 8.060 77.579 236,751 81,1311 LIABILITIES Current liabilities Trade and other payables interest bearing liabilities Derivative financial instruments Current tax liabilities Current lease liabilities Total current liabilities Non-current liabilities Derivative financial instruments Non-current trade and other payables Interest bearing liabilities Deferred tax Non-current lease liabilities Total non-current liabilities Total liabilities 42 9 3.15 14 413 241 270 41 25.500 23 45,851 81 452 220 344 3.42 71,360 557,479 794,230 152,491 Net assets 779,202 442,062 or comprenensive income For the Year Ended 31 July 2020 Section 2020 NZ$'000 2019 NZ$'000 Sales 2.2. 538,855 Cost of sales 801,524 (334,493) 467,031 (206,362) 332,493 Gross profit 2.2 27,369 1,130 Other income Selling expenses Administration and general expenses 2.2 2.2 (169,272) (176,237) (318,140) 148,891 (160,581) 173,477) (232,928) 99,565 Earnings before interest, tax, depreciation and amortisation 3.2-3.4 Depreciation and amortisation Earnings before interest and tax (103,027) 45,864 (15,272) 84,293 449 37 Finance income Finance expenses Finance costs - net (25,803) 23,354) (2,952) (2,915) 4.1.1 22,510 Profit before income tax Income tax expense 81,378 (23,745) 2.3 (13,631) Profit after income tax 8,879 57,633 8.145 57,633 734 Profit for the period attributable to: Shareholders of the company Non-controlling interest Other comprehensive income (expense) that may be recycled through profit or loss: Movement in cash flow hedge reserve Movement in foreign currency translation reserve Movement in other reserves Other comprehensive expense for the year, net of tax 4.3.2 19.259) 620 4.3.2 259 (3,297) 4.3.2 (61) (9,061) (2,677) Total comprehensive income/expense) for the year (182) 54,956 Total comprehensive income (expense) for the period attributable to: Shareholders of the company Non-controlling interest 1920) 54,956 738 2.4 1.7cps 2.4 Basic earnings per share Diluted earnings per share Weighted average basic ordinary shares outstanding ('000) Weighted average diluted ordinary shares outstanding ('000) 1.6cps 493,347 16.0cps 15.9cps 359,600 2.4 2.4 494,582 361,566 For the Year Ended 31 July 2020 Section 2020 NZS 000 2019 NZS000 546,499 Cash flows from operating activities Cash was provided from: Receipts from customers Government grants received Interest received Income tax received B23,951 21.266 449 621 1379 847,045 207 547,327 638,393 455,743 Cash was applied to: Payments to suppliers and employees Income tax paid Interest paid 16,897 21.960 677,250 26,673 3,237 485,653 169,795 61,674 Net cash inflow from operating activities Cash flows from investing activities Cash was provided from: Proceeds from sale of property, plant and equipment Proceeds from sale of non-controlling interest Proceeds from investment in other financial assets 61 141 22,321 22,322 202 Cash was applied to: Purchase of property, plant and equipment Purchase of intangibles Acquisition of subsidiaries 3.2 33 15,390 4,463 376,121 395983 11,345 4,351 22,321 51 38,017 (395,781) (15,695) Net cash (outflow) from investing activities Cash flows from financing activities Cash was provided from Proceeds of loan advances Proceeds from share issues 92,606 506,746 340.646 847,392 92,606 33,883 Cash was applied to: Dividends paid Repayment of loan advances Repayment of lease liabilities 106,606 27,209 293,757 76,744 397,710 140,489 449,682 (47,883) Net cash inflow / (outfiow) from financing activities Net increase/ (decrease) in cash and cash equivalents held 223,696 (1,904)


