

Question
Using the financials from the Financial Analysis assignment, prepare two sets of business valuation schedules as of June 30, 2017 using the Net Asset Value,
Using the financials from the Financial Analysis assignment, prepare two sets of business valuation schedules as of June 30, 2017 using the Net Asset Value, , and Comparative Transaction Method approaches. The first set based on the financial information provided. The second set including the assumptions below:
- Breach of contract caused the loss of a project in 2015 that generated $1,000,000 of revenue each year.
- The company had to use cash reserves of $200,000 to cover expenses due to the loss of the contract.
- The project had a gross profit margin between 45%-55% for each of the last 5 years.
You can assume any other details of the analysis.
The valuation schedules can be submitted using the assignment link. pls help
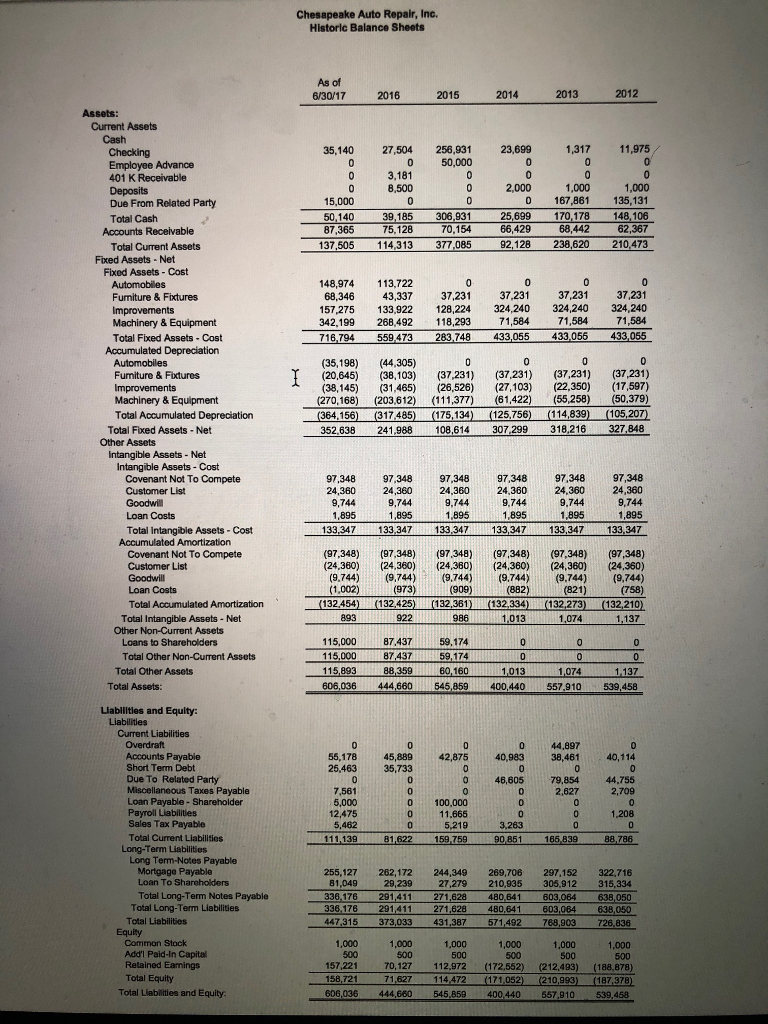
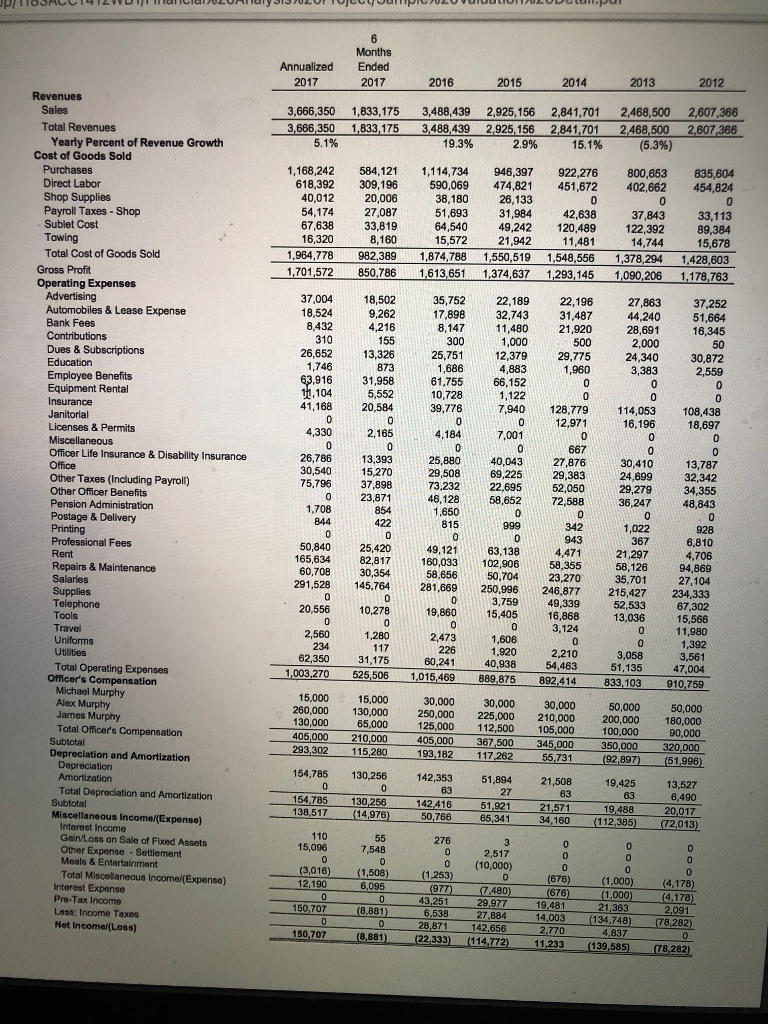
Chesapeake Auto Repair, Inc. Historlc Balance Sheets 2012 2014 2013 6/30/17 2016 2015 Current Assets Cash 11,975 256,931 50,000 23,699 1,317 35.140 27,504 Checking Employee Advance Receivable Denosits Due From Related Party 3.181 8.500 1.000 1,000 135,131 0 2,000 15.000 167.861 0 39.185 75.128 25.699 66.429 170,178 50.140 87.365 306,931 70.154 148,106 62.367 Total Cash 68,442 Accounts Receivable 92,128 238.620 210.473 137,505 114,313 377,085 Total Current Assets Fbxed Assets-Net ost 0 113,722 148,974 68,346 Automobiles Funiture & Fixtures 37,231 37,231 37,231 324,240 43.337 37.231 324,240 157,275 342,199 133.922 128.224 324,240 Improvements Machinery & Equipment 268,492 118,293 433 055 433,056 433,055 283,748 716,794 559,473 Accumulated Depreciation 0 C Automobiles Fumiture & Fixtures (35,198) (20.645) (44,305) (38.103) (37.231) (37,231) (37,231) (37,231) (26,526) (31,465) Improvements (38,145) 55 258 02791 614221 Equipment (317.485) Total Accumulated Depreciation (105,207) (125,756) (114,839) 318.216 (364,156) (175,134) 327,848 Total Fixed Assets -Net 241,988 307.299 352.638 108.614 Other Assets Intangible Assets- Net Intangible Assets Cost Compete Cuctomer i 4 360 24 360 24.360 24.360 24 360 24 360 9,744 9.744 9,744 Goodwill 9.744 9,744 9,744 1.895 1,895 1.895 1.895 1,895 1,895 Loan Costs Total Intangibie Assets - Cost 133,347 133,347 133,347 133,347 133.347 133,347 Ac Couenant Not To Compete (97,348) (24.360) (97,348) (24,360) 97,348) (24,360) (9,744) (97.348) (97,348) (24,360) (9,744) (821) (97,348) (24,360) (9,744) Customer List Goodwill (24,360) (9,744) (9,744) (9,744) Lban Costs (132.361) (132 132 mulated Amortization (13 Total Intangible Assets- Net Other Non-Current Assets Loans to Shareholders 922 986 1.013 1.074 1.137 115,000 87,437 59,174 0 0 115,000 87,437 59,174 Total Other Non-Current Assets Total Other Assets 115,893 88,359 60,160 1,013 1,074 1,137 606,036 444,660 545,859 400.440 Total Assets: 557.910 539,458 Liablilities and Equity: Liabilities Liabilities Overdraft C C 44.897 Accounts Payable 55,178 5,889 35,733 42,875 40.983 40,114 38.461 25,463 Due To Related Party Miscellaneous Taxes Payable Loan Payable- Shareholder 46,605 79 854 44 755 2,709 7,561 2.827 5,000 100.000 C C 12 1.2 Sales Tax Payable 5219 3,263 C 111.139 Total Current Liabilities 1.622 159,759 90,851 166.839 8,786 Long-Term Liabilities Pavable Mortgage Payable Loan To Shareholders Total Long-Term Notes Payable Total Long-Term Liabilities 255,127 262,172 29.239 244,349 27,279 269,706 210.935 480,641 297.152 322,716 315.334 81,049 305.912 271,628 336,176 291,411 291,411 373,033 603,064 638,050 638,050 336.176 271,626 480,641 603,064 Liabilities 447,315 431,387 571,49 768,903 726,836 Equity Common Stock 1.000 1,000 1,000 1,000 1.000 1,000 Betiged Eaminns 70. 127 71,627 8791 (18 (212.493) (171,052) (210,993) (187,378) 157.221 112.972 (172.552) 114,472 Total Equity 158,721 Total Liabilities and Equity: 606 036 444 660 545 859 400 440 557 910 539.458 TT TTH Months Annualized Ended 2013 2017 2017 2016 2015 2014 2012 Revenues Sales 2,841,701 2,841,701 9% 2,607,366 3,666,350 1,833,175 3,488,439 2,925,156 2,468,500 2.468.500 Total Revenues Yearly Percent of Revenue Growth Cost of Goods Sold 3,666,350 1,833,175 3,488, 19.3% 2,925,156 2,607,366 5.1% 15.1 % (5.3%) Purchases 1,168.242 584,121 1,114,734 946,397 922,276 451,672 800,653 835,604 454,824 Direct Labor Shop Supplies 618.392 309.196 590,069 474.821 402,662 40,012 20,006 38,180 26,133 0 0 0 54,174 27,087 Payroll Taxes Shop 51,693 31,984 49,242 42,638 37,843 122.392 33,113 89,384 15,678 3: 160 120,489 11,481 15.572 Towing 16.320 14,744 Total Cost of Goods Sold 1550.519 1,964,778 982.389 1,378,294 1,874,788 1,548,556 1,428,603 Gross Profit 1,701,572 850.78 1,613,651 1,374,637 1,293,145 1,090,206 1,178,763 Operating Expenses Advertising Automobiles & Lease Expense 37,004 18.524 18,502 35,752 17.898 8,147 22,189 32,743 22,196 31,487 21.920 27,863 37,252 9,262 44,240 28,691 2,000 51,664 16,345 50 Bank Fees 8,432 310 4.216 11.480 ns 155 300 1.000 500 Dues & Subscriptions 2 1746 13 12,379 29,775 1.9 24,340 30,872 2,559 Education 873 3,383 Employee Benefits Equipment Rental 63,916 1,104 31,958 5,552 61,755 66.152 10,728 1,122 7,940 0 41,168 20,584 39.776 128.779 114.053 108,438 18,697 Janitorial 0 12.971 16.196 Licenses & Permits Miscellaneous Officer Life Insurance & Disability Insurance Office 4.330 2.165 4,184 7,001 0 26,786 30,540 75,796 13,393 15.270 5,880 29,508 73,232 46,128 40,043 69.225 22,695 8,652 27.876 20 382 30,410 13,787 37.898 Ofber Including Payroll 34.355 52.050 72,588 29,279 36,247 23,871 Pension Administration Postage & Delivery Printing 48,843 1.70 0 844 422 1,022 928 043 C ssional Fees 50,840 25,420 82,817 49,121 4706 63.138 102.906 4,471 58,355 23.270 Rent 21,297 58,126 35,701 215,427 160,033 Repairs & Maintenance Salaries Supplies hone Tools 94,869 27,104 234,333 50,704 281 669 291,528 145,764 0 g 339 C 759 20,556 10,278 19,860 15,405 16.868 13.036 C Travel 3.124 11,980 1,392 2,560 234 62,350 1280 Uniforms 0 2 210 117 226 3,058 51 3,561 31,175 60,241 40,938 Total Operating Expenses Officer's Compensation Michael Murphy 54.463 1,003.270 525,506 1,015,469 889.875 892.414 833.103 910,759 15,000 260,000 130.000 15,000 130.000 65,000 210,000 115.280 30.000 250 000 30,000 30,000 50.000 50,000 hy 180,000 200,000 105.000 125,000 112.500 Total Officer's Compensation Subtotal Depreciation and Amortization 405,000 405,000 367,500 350,000 320 000 345,000 55.731 293,302 193,182 117.262 (92,897) (51.996) Amortization 154.785 130.256 142.353 51.894 21,508 19,425 13,527 0 Total Depreciation and Amortization Subtotal 63 27 63 154,785 130.256 142,416 50.766 51,921 21,571 20.017 19,488 (14,976) 65,341 34.160 Interent ncome/(Expense) (112,385) (72,013) 110 GainLoss on Sale of Fixed Assets 55 276 3 0 15,096 Other Expense Settlement 7,548 2,517 (10,000) 0 Entertainment (3,016) 12.190 (1,508) 6.095 Total Miscelaneous Income/(Expense) Intereet (1,253) (676) (1,000) 1,000) (4,178) (676) (4,178) 2,091 (78,282) Pre-Tax Income C 43.251 150,707 (8,881) 21,363 136 Less: Income Taxes 6,538 28,871 (22,333) 14.003 27,884 142.656 Net Income/(Loss) 4,837 2,770 11,233 150.707 (8,881) (114,772) (139,585) (78,282) -A TIFIF Chesapeake Auto Repair, Inc. Historlc Balance Sheets 2012 2014 2013 6/30/17 2016 2015 Current Assets Cash 11,975 256,931 50,000 23,699 1,317 35.140 27,504 Checking Employee Advance Receivable Denosits Due From Related Party 3.181 8.500 1.000 1,000 135,131 0 2,000 15.000 167.861 0 39.185 75.128 25.699 66.429 170,178 50.140 87.365 306,931 70.154 148,106 62.367 Total Cash 68,442 Accounts Receivable 92,128 238.620 210.473 137,505 114,313 377,085 Total Current Assets Fbxed Assets-Net ost 0 113,722 148,974 68,346 Automobiles Funiture & Fixtures 37,231 37,231 37,231 324,240 43.337 37.231 324,240 157,275 342,199 133.922 128.224 324,240 Improvements Machinery & Equipment 268,492 118,293 433 055 433,056 433,055 283,748 716,794 559,473 Accumulated Depreciation 0 C Automobiles Fumiture & Fixtures (35,198) (20.645) (44,305) (38.103) (37.231) (37,231) (37,231) (37,231) (26,526) (31,465) Improvements (38,145) 55 258 02791 614221 Equipment (317.485) Total Accumulated Depreciation (105,207) (125,756) (114,839) 318.216 (364,156) (175,134) 327,848 Total Fixed Assets -Net 241,988 307.299 352.638 108.614 Other Assets Intangible Assets- Net Intangible Assets Cost Compete Cuctomer i 4 360 24 360 24.360 24.360 24 360 24 360 9,744 9.744 9,744 Goodwill 9.744 9,744 9,744 1.895 1,895 1.895 1.895 1,895 1,895 Loan Costs Total Intangibie Assets - Cost 133,347 133,347 133,347 133,347 133.347 133,347 Ac Couenant Not To Compete (97,348) (24.360) (97,348) (24,360) 97,348) (24,360) (9,744) (97.348) (97,348) (24,360) (9,744) (821) (97,348) (24,360) (9,744) Customer List Goodwill (24,360) (9,744) (9,744) (9,744) Lban Costs (132.361) (132 132 mulated Amortization (13 Total Intangible Assets- Net Other Non-Current Assets Loans to Shareholders 922 986 1.013 1.074 1.137 115,000 87,437 59,174 0 0 115,000 87,437 59,174 Total Other Non-Current Assets Total Other Assets 115,893 88,359 60,160 1,013 1,074 1,137 606,036 444,660 545,859 400.440 Total Assets: 557.910 539,458 Liablilities and Equity: Liabilities Liabilities Overdraft C C 44.897 Accounts Payable 55,178 5,889 35,733 42,875 40.983 40,114 38.461 25,463 Due To Related Party Miscellaneous Taxes Payable Loan Payable- Shareholder 46,605 79 854 44 755 2,709 7,561 2.827 5,000 100.000 C C 12 1.2 Sales Tax Payable 5219 3,263 C 111.139 Total Current Liabilities 1.622 159,759 90,851 166.839 8,786 Long-Term Liabilities Pavable Mortgage Payable Loan To Shareholders Total Long-Term Notes Payable Total Long-Term Liabilities 255,127 262,172 29.239 244,349 27,279 269,706 210.935 480,641 297.152 322,716 315.334 81,049 305.912 271,628 336,176 291,411 291,411 373,033 603,064 638,050 638,050 336.176 271,626 480,641 603,064 Liabilities 447,315 431,387 571,49 768,903 726,836 Equity Common Stock 1.000 1,000 1,000 1,000 1.000 1,000 Betiged Eaminns 70. 127 71,627 8791 (18 (212.493) (171,052) (210,993) (187,378) 157.221 112.972 (172.552) 114,472 Total Equity 158,721 Total Liabilities and Equity: 606 036 444 660 545 859 400 440 557 910 539.458 TT TTH Months Annualized Ended 2013 2017 2017 2016 2015 2014 2012 Revenues Sales 2,841,701 2,841,701 9% 2,607,366 3,666,350 1,833,175 3,488,439 2,925,156 2,468,500 2.468.500 Total Revenues Yearly Percent of Revenue Growth Cost of Goods Sold 3,666,350 1,833,175 3,488, 19.3% 2,925,156 2,607,366 5.1% 15.1 % (5.3%) Purchases 1,168.242 584,121 1,114,734 946,397 922,276 451,672 800,653 835,604 454,824 Direct Labor Shop Supplies 618.392 309.196 590,069 474.821 402,662 40,012 20,006 38,180 26,133 0 0 0 54,174 27,087 Payroll Taxes Shop 51,693 31,984 49,242 42,638 37,843 122.392 33,113 89,384 15,678 3: 160 120,489 11,481 15.572 Towing 16.320 14,744 Total Cost of Goods Sold 1550.519 1,964,778 982.389 1,378,294 1,874,788 1,548,556 1,428,603 Gross Profit 1,701,572 850.78 1,613,651 1,374,637 1,293,145 1,090,206 1,178,763 Operating Expenses Advertising Automobiles & Lease Expense 37,004 18.524 18,502 35,752 17.898 8,147 22,189 32,743 22,196 31,487 21.920 27,863 37,252 9,262 44,240 28,691 2,000 51,664 16,345 50 Bank Fees 8,432 310 4.216 11.480 ns 155 300 1.000 500 Dues & Subscriptions 2 1746 13 12,379 29,775 1.9 24,340 30,872 2,559 Education 873 3,383 Employee Benefits Equipment Rental 63,916 1,104 31,958 5,552 61,755 66.152 10,728 1,122 7,940 0 41,168 20,584 39.776 128.779 114.053 108,438 18,697 Janitorial 0 12.971 16.196 Licenses & Permits Miscellaneous Officer Life Insurance & Disability Insurance Office 4.330 2.165 4,184 7,001 0 26,786 30,540 75,796 13,393 15.270 5,880 29,508 73,232 46,128 40,043 69.225 22,695 8,652 27.876 20 382 30,410 13,787 37.898 Ofber Including Payroll 34.355 52.050 72,588 29,279 36,247 23,871 Pension Administration Postage & Delivery Printing 48,843 1.70 0 844 422 1,022 928 043 C ssional Fees 50,840 25,420 82,817 49,121 4706 63.138 102.906 4,471 58,355 23.270 Rent 21,297 58,126 35,701 215,427 160,033 Repairs & Maintenance Salaries Supplies hone Tools 94,869 27,104 234,333 50,704 281 669 291,528 145,764 0 g 339 C 759 20,556 10,278 19,860 15,405 16.868 13.036 C Travel 3.124 11,980 1,392 2,560 234 62,350 1280 Uniforms 0 2 210 117 226 3,058 51 3,561 31,175 60,241 40,938 Total Operating Expenses Officer's Compensation Michael Murphy 54.463 1,003.270 525,506 1,015,469 889.875 892.414 833.103 910,759 15,000 260,000 130.000 15,000 130.000 65,000 210,000 115.280 30.000 250 000 30,000 30,000 50.000 50,000 hy 180,000 200,000 105.000 125,000 112.500 Total Officer's Compensation Subtotal Depreciation and Amortization 405,000 405,000 367,500 350,000 320 000 345,000 55.731 293,302 193,182 117.262 (92,897) (51.996) Amortization 154.785 130.256 142.353 51.894 21,508 19,425 13,527 0 Total Depreciation and Amortization Subtotal 63 27 63 154,785 130.256 142,416 50.766 51,921 21,571 20.017 19,488 (14,976) 65,341 34.160 Interent ncome/(Expense) (112,385) (72,013) 110 GainLoss on Sale of Fixed Assets 55 276 3 0 15,096 Other Expense Settlement 7,548 2,517 (10,000) 0 Entertainment (3,016) 12.190 (1,508) 6.095 Total Miscelaneous Income/(Expense) Intereet (1,253) (676) (1,000) 1,000) (4,178) (676) (4,178) 2,091 (78,282) Pre-Tax Income C 43.251 150,707 (8,881) 21,363 136 Less: Income Taxes 6,538 28,871 (22,333) 14.003 27,884 142.656 Net Income/(Loss) 4,837 2,770 11,233 150.707 (8,881) (114,772) (139,585) (78,282) -A TIFIF
Step by Step Solution
There are 3 Steps involved in it
Step: 1

Get Instant Access to Expert-Tailored Solutions
See step-by-step solutions with expert insights and AI powered tools for academic success
Step: 2

Step: 3
Ace Your Homework with AI
Get the answers you need in no time with our AI-driven, step-by-step assistance
Get Started
Auditing The Art And Science Of Assurance Engagements
Authors: Alvin A. Arens, Randal J. Elder, Mark S. Beasley, Ingrid B. Splettstoesser-Hogeterp
11th Edition
0132088061, 978-0132088060