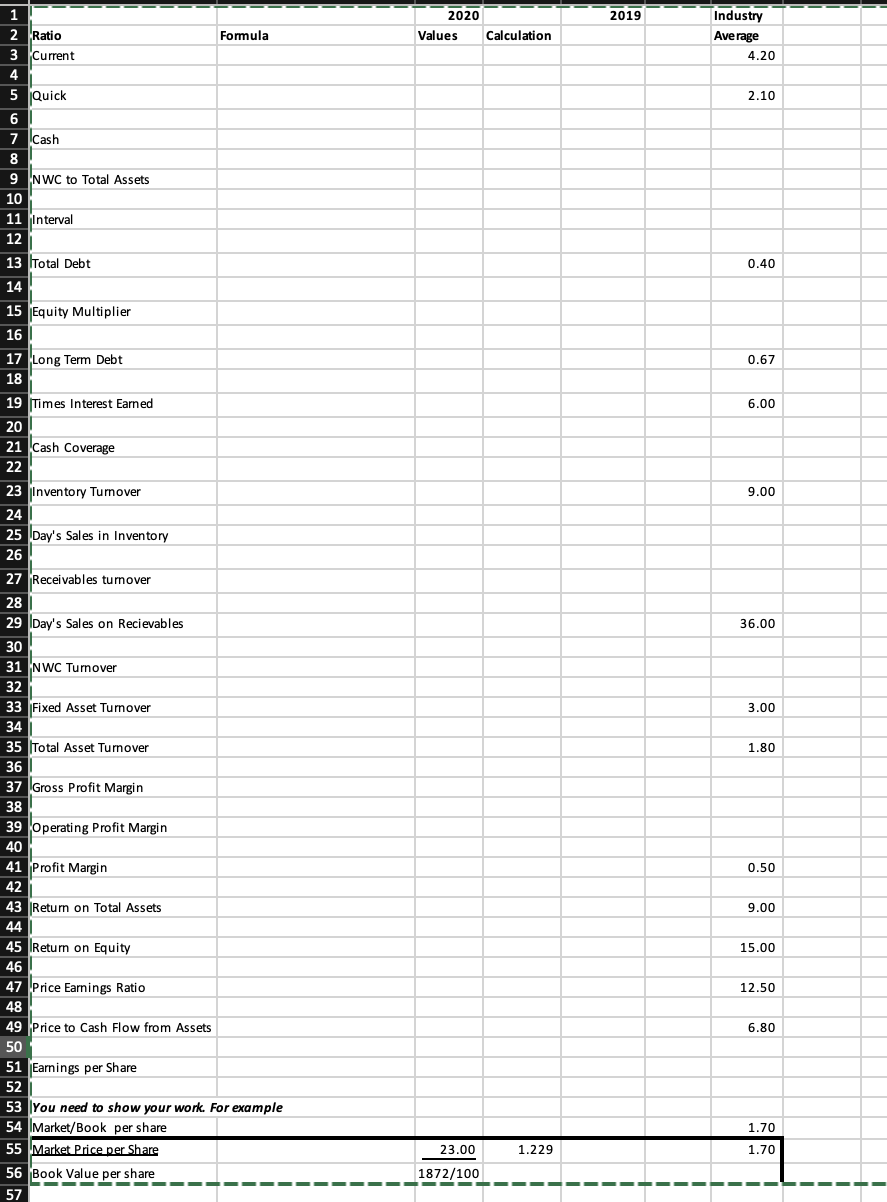
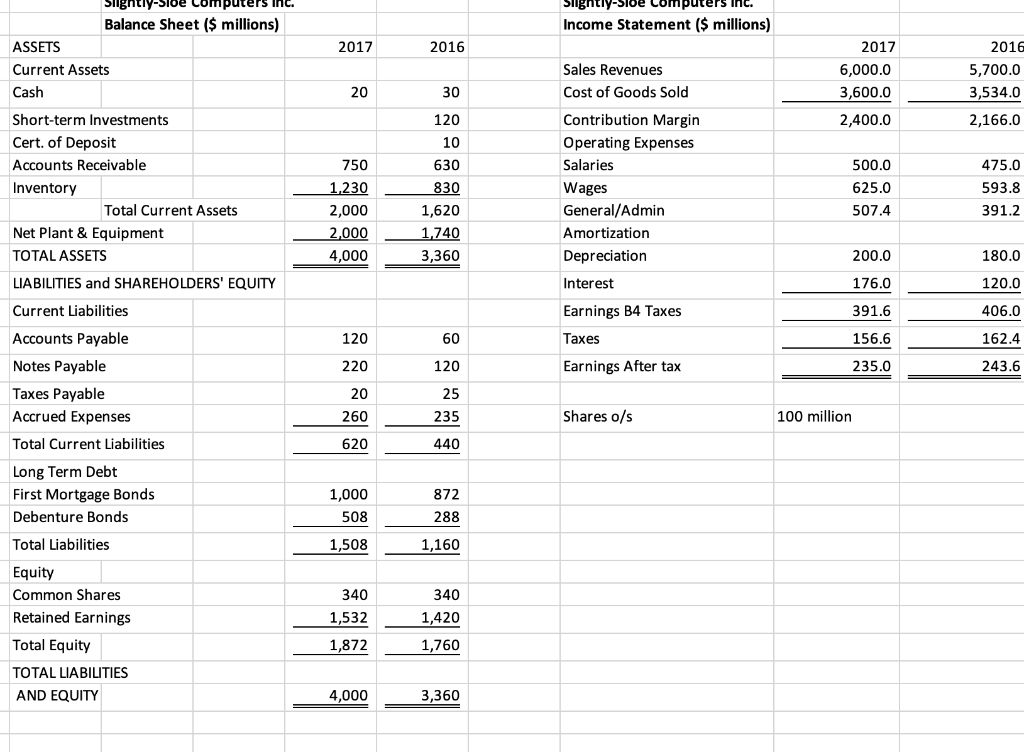
Using the following excel spreadsheet (the spreadsheet is incorporated in the word document) complete the ratios for Halifax Super Computers Inc. Show your work! Each ratio is worth a each and the cash flow from asses is worth 1 mark)


2019 2020 Values Formula Calculation Industry Average 4.20 2.10 1 2 Ratio 3 Current 4 5 Quick 6 7 Cash 8 9 NWC to Total Assets 10 11 Interval 12 13 Total Debt 14 15 Equity Multiplier 16 17 Long Term Debt 18 0.40 0.67 6.00 19 Times Interest Earned 20 21 Cash Coverage 22 9.00 23 Inventory Turnover 24 25 Day's Sales in Inventory 26 27 Receivables turnover 36.00 3.00 1.80 28 29 Day's Sales on Recievables 30 31 NWC Turnover 32 33 Fixed Asset Turnover 34 35 Total Asset Tumover 36 37 Gross Profit Margin 38 39 Operating Profit Margin 40 41 Profit Margin 42 43 Return on Total Assets 44 45 Return on Equity 46 47 Price Earnings Ratio 48 49 Price to Cash Flow from Assets 50 51 Earnings per Share 0.50 9.00 15.00 12.50 6.80 52 1.70 53 You need to show your work. For example 54 IMarket/Book per share 55 Market Price per Share 56 Book Value per share 57 23.00 1.229 1.70 1872/100 Ently sioe Income Statement ($ millions) Signtiy-side Balance Sheet ($ millions) ASSETS Current Assets Cash 2017 2016 Sales Revenues Cost of Goods Sold 2017 6,000.0 3,600.0 2,400.0 2016 5,700.0 3,534.0 20 30 2,166.0 120 10 630 Short-term Investments Cert. of Deposit Accounts Receivable Inventory Total Current Assets Net Plant & Equipment TOTAL ASSETS LIABILITIES and SHAREHOLDERS' EQUITY Current Liabilities 750 1,230 2,000 2,000 4,000 Contribution Margin Operating Expenses Salaries Wages General/Admin Amortization Depreciation Interest 500.0 625.0 507.4 475.0 593.8 391.2 830 1,620 1,740 3,360 200.0 180.0 176.0 120.0 391.6 406.0 Earnings B4 Taxes Taxes 120 60 156.6 162.4 220 120 Earnings After tax 235.0 243.6 Accounts Payable Notes Payable Taxes Payable Accrued Expenses Total Current Liabilities 20 260 25 235 Shares o/s 100 million 620 440 Long Term Debt First Mortgage Bonds Debenture Bonds 1,000 508 872 288 Total Liabilities 1,508 1,160 Equity Common Shares Retained Earnings Total Equity 340 1,532 340 1,420 1,872 1,760 TOTAL LIABILITIES AND EQUITY 4,000 - 3,360 4,000 3,360 2019 2020 Values Formula Calculation Industry Average 4.20 2.10 1 2 Ratio 3 Current 4 5 Quick 6 7 Cash 8 9 NWC to Total Assets 10 11 Interval 12 13 Total Debt 14 15 Equity Multiplier 16 17 Long Term Debt 18 0.40 0.67 6.00 19 Times Interest Earned 20 21 Cash Coverage 22 9.00 23 Inventory Turnover 24 25 Day's Sales in Inventory 26 27 Receivables turnover 36.00 3.00 1.80 28 29 Day's Sales on Recievables 30 31 NWC Turnover 32 33 Fixed Asset Turnover 34 35 Total Asset Tumover 36 37 Gross Profit Margin 38 39 Operating Profit Margin 40 41 Profit Margin 42 43 Return on Total Assets 44 45 Return on Equity 46 47 Price Earnings Ratio 48 49 Price to Cash Flow from Assets 50 51 Earnings per Share 0.50 9.00 15.00 12.50 6.80 52 1.70 53 You need to show your work. For example 54 IMarket/Book per share 55 Market Price per Share 56 Book Value per share 57 23.00 1.229 1.70 1872/100 Ently sioe Income Statement ($ millions) Signtiy-side Balance Sheet ($ millions) ASSETS Current Assets Cash 2017 2016 Sales Revenues Cost of Goods Sold 2017 6,000.0 3,600.0 2,400.0 2016 5,700.0 3,534.0 20 30 2,166.0 120 10 630 Short-term Investments Cert. of Deposit Accounts Receivable Inventory Total Current Assets Net Plant & Equipment TOTAL ASSETS LIABILITIES and SHAREHOLDERS' EQUITY Current Liabilities 750 1,230 2,000 2,000 4,000 Contribution Margin Operating Expenses Salaries Wages General/Admin Amortization Depreciation Interest 500.0 625.0 507.4 475.0 593.8 391.2 830 1,620 1,740 3,360 200.0 180.0 176.0 120.0 391.6 406.0 Earnings B4 Taxes Taxes 120 60 156.6 162.4 220 120 Earnings After tax 235.0 243.6 Accounts Payable Notes Payable Taxes Payable Accrued Expenses Total Current Liabilities 20 260 25 235 Shares o/s 100 million 620 440 Long Term Debt First Mortgage Bonds Debenture Bonds 1,000 508 872 288 Total Liabilities 1,508 1,160 Equity Common Shares Retained Earnings Total Equity 340 1,532 340 1,420 1,872 1,760 TOTAL LIABILITIES AND EQUITY 4,000 - 3,360 4,000 3,360


