Question
Municipal Credit Analysis.* In the 2010 CAFR, Detroit indicated that its general obligation debt rating had been downgraded by Moodys Investors Services from a Ba2
Municipal Credit Analysis.* In the 2010 CAFR, Detroit indicated that its general obligation debt rating had been downgraded by Moody’s Investors Services from a Ba2 to a Ba3. Based on its fourth quarter Performance Dashboard 1, Detroit was subsequently downgraded to junk bond status as of the fourth quarter of 2012 by all three rating services (Caa2, Moody’s; CCC-, Standard & Poor’s; CCC-, Fitch). The audit of the 2011–2012 financial reports resulted in the following statement from its auditor, KPMG:
“The City has an accumulated unassigned deficit in the General Fund of $326.6 million as of June 30, 2012, which has resulted from operating deficits over the last several years. The deficits raise significant liquidity risks regarding the City’s ability to meet its financial obligations as they come due without raising revenues, cutting costs of services provided, and effectuating financial restructuring.” 2
As Detroit indicates in its 2012 CAFR report, the city faces socioeconomic factors that make it difficult for the city to regain its financial footing:
The City of Detroit is the largest City in Michigan and the 18th largest City in the United States. However, as documented in the 2010 Census, the City’s population continues to decline, which contributes to the declining property and income tax base. In addition, the City faces continued high unemployment (18.9% in October 2012), which hinders personal income tax collections. Resident home foreclosures and delinquent property tax levels are another financial concern. The weak economy has had an adverse impact on the State’s budget resulting in cuts of revenue sharing to local governments. The City’s revenue sharing for the year ended June 30, 2012 was $173.3 million or $66.0 million less than the year ended June 30, 2011.
Although the City’s current economic condition is poor, the future outlook for recovery and improvement is positive. Businesses are transferring employees from suburban cities to the City of Detroit. New residents are moving into the City’s mid-town area.
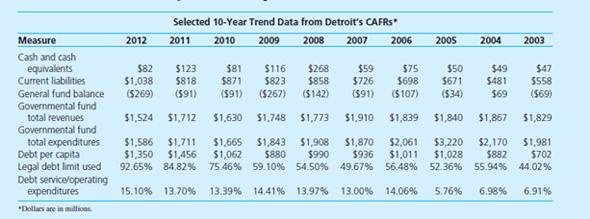
Following are selected financial indicators from Detroit’s CAFRs, which provide financial data that can be used to help identify financial trends the city has experienced with regard to its economic condition.

In July of 2013 Detroit filed for bankruptcy. 3 Since its bankruptcy filing, numerous events have occurred that impact the city’s economic condition.
Required:
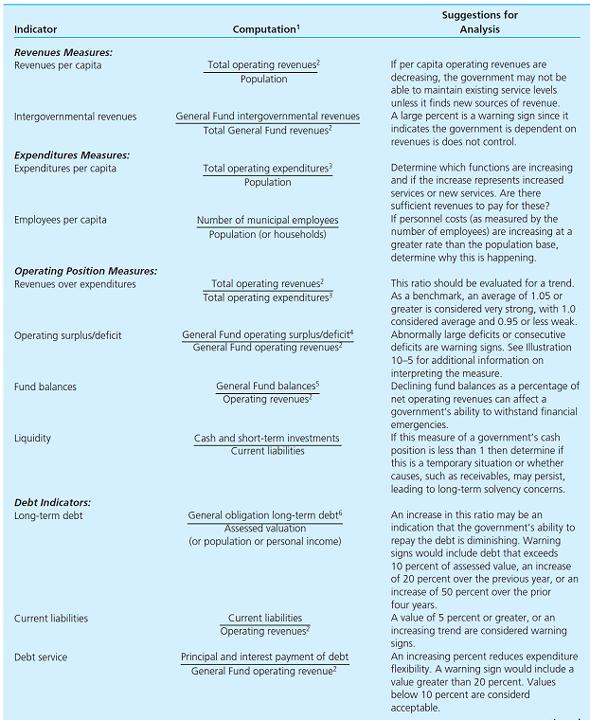
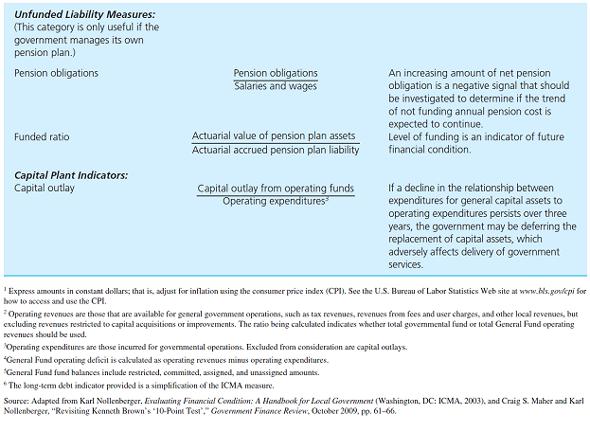
a. Using the information provided in the case, the information provided in the Illustrations 10–3 and 10–4, and the information provided in the Credit Analyst Models section of the text provide an analysis of factors that would lead to the downgrading of the debt rating.
b. The City of Detroit’s Finance Department provides quarterly performance indicators on financial sustainability and some economic indicators along with service performance. Additionally, the Emergency Manager for the bankruptcy provides quarterly filings on the Detroit Web site. These quarterly reports provide a status update on Detroit’s financial situation. Using the information provided by the Finance Department and the Emergency Manager, assess the city’s economic condition. As part of the assessment indicate whether you believe the city’s condition has improved, worsened, or remained the same since 2012.
* This case represents an update to the Detroit case that can be found in the 16th edition of the textbook.
1 http://www.detroitmi.gov/DepartmentsandAgencies/Finance/PerformanceIndicators.aspx
2 Comprehensive Annual Financial Report, Independent Auditors Report, Detroit, Michigan, 2012, p 2.
3 Michael Corkery and Matthew Dolan, “Detroit Bankruptcy Likely to Spark a Pension Brawl; Filing Will be a Test Case of How Far a City Can Go in Shedding Retiree Costs,” The Wall Street Journal (online), July 20, 2013.
ILLUSTRATION 10–3 Selected Financial Ratios Based On CAFR Governmental Funds Information


ILLUSTRATION 10–4

Selected 10-Year Trend Data from Detroit's CAFRS Measure 2012 2011 2010 2009 2008 2007 2006 2005 2004 2003 Cash and cash equivalents Current liabilities $82 $1,038 (S269) $123 $81 $871 $116 $823 (S267) $268 $858 ($142) $59 $726 ($91) $75 $698 $50 $49 $481 $47 $818 $671 $558 General fund balance Governmental fund total revenues Governmental fund total expenditures Debt per capita Legal debt limit used Debt service/operating expenditures (S91) (S91) (S107) ($34) $69 ($69) $1,524 $1,712 $1,630 $1,748 $1,773 $1,910 $1,839 $1,840 $1,867 $1,829 $1,586 $1,350 $1,711 $1,456 $1,843 $880 75.46% 59.10% 54.50% $1,665 $1,062 $1,908 $990 $2,061 $1,011 49.67% 56.48% 52.36% $1,870 $936 $3,220 $1,028 $2,170 $882 $1,981 $702 92.65% 84.82% 55.94% 44.02% 15.10% 13.70% 13.39% 14.41% 13.97% 13.00% 14.069% 5.76% 6.98% 6.91% *Dollars are in millions
Step by Step Solution
3.47 Rating (150 Votes )
There are 3 Steps involved in it
Step: 1
solution Step 1 of 14 Public funds Public funds are the funds that are coming from public treasury Public fund generally generates revenues from the tax payment The government revenue is the source fo...
Get Instant Access to Expert-Tailored Solutions
See step-by-step solutions with expert insights and AI powered tools for academic success
Step: 2

Step: 3

Ace Your Homework with AI
Get the answers you need in no time with our AI-driven, step-by-step assistance
Get Started


