Answered step by step
Verified Expert Solution
Link Copied!

Question

1 Approved Answer

Using the following link: https://www.jdplc.com/reports-presentations download JD Sports Fashion Plc's annual reports for the past 3 (most recent) years to provide a critical analysis of

Using the following link: https://www.jdplc.com/reports-presentations download JD Sports Fashion Plc's annual reports for the past 3 (most recent) years to provide a critical analysis of the financial health of the company. The annual reports are in a consolidated format, and relevant financial statements can be found under the latest results (results archive) section. Do not forget to review the notes to the financial statements.

The FULL document is available at coursehero (https://www.coursehero.com/file/104408128/JD-Sports-Fashion-Plcspdf).

The reports with the financial data to calculate the ratios are at https://www.jdplc.com/reports-presentations.

Exact Reports location for last years. 2020: https://files.jdplc.com/pdf/reports/annual-report-and-accounts-2020.pdf, 2019: https://files.jdplc.com/pdf/reports/annual-report-2019.pdf and 2018: https://files.jdplc.com/pdf/reports/2018-annual-report-v1.pdf

Question:

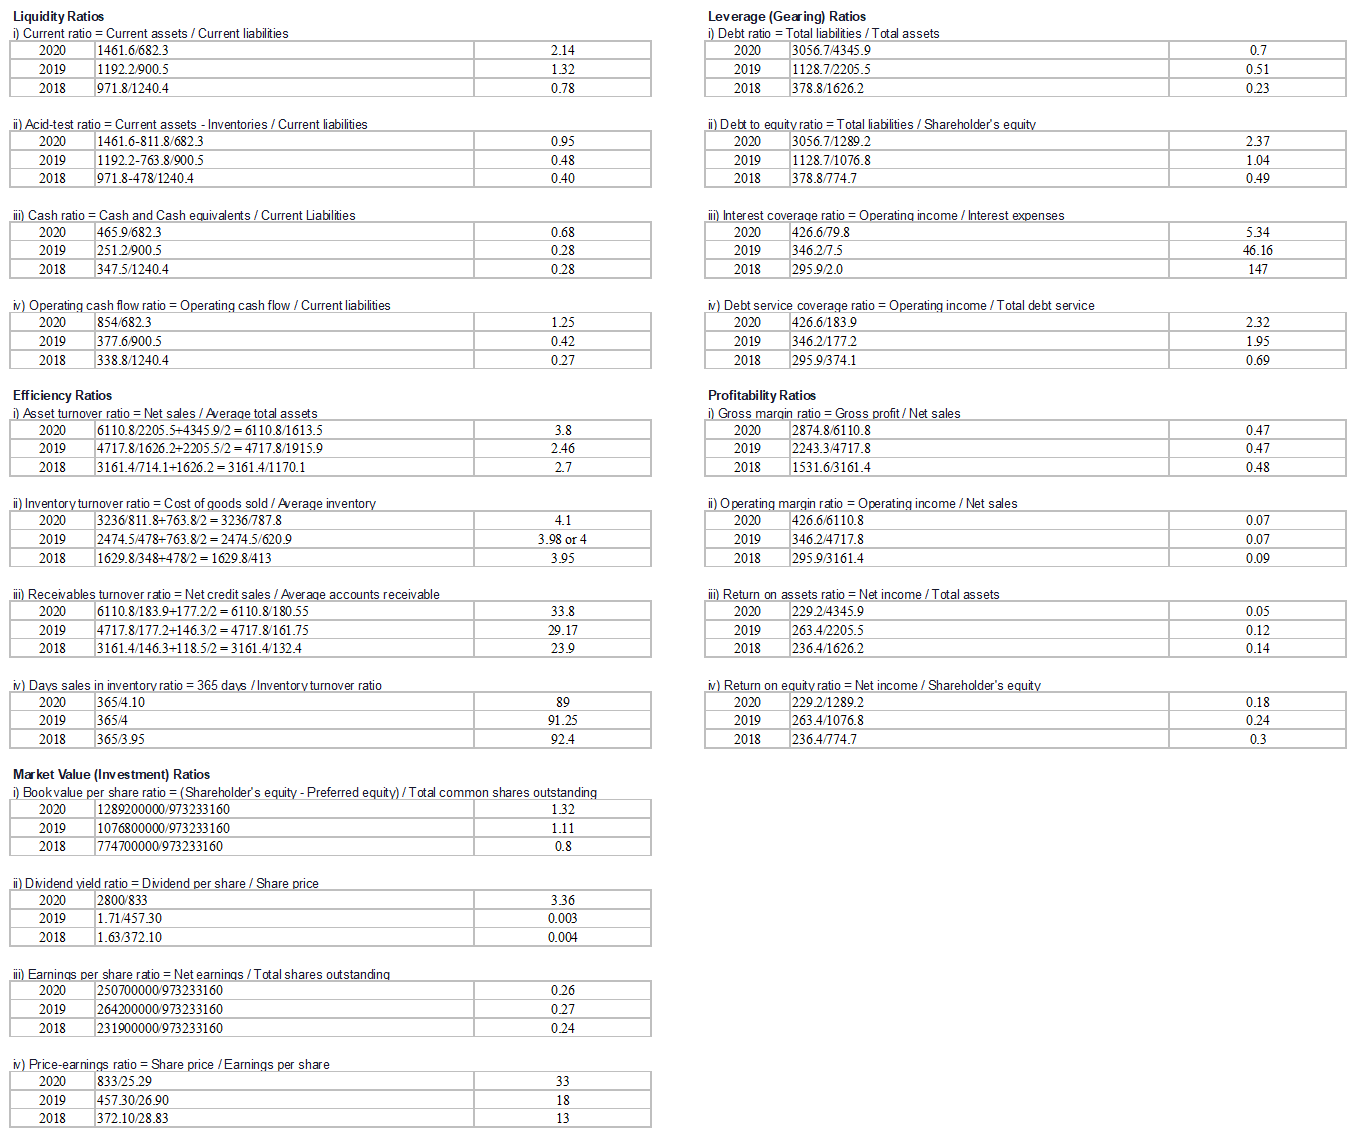
Interpret and assess the trend of the financial performance of JD Sports Fashion Plc in the most recent year (the newest annual report) in comparison to the previous years and to its competitors/industry. Please justify any significant differences for the trends observed according provided ratios table (see attached picture).

image text in transcribed
Liquidity Ratios Leverage (Gearing) Ra 1) Current ratio = Current assets / Current liabilities 1) Debt ratio = Total liabilities / Total assets 2020 1461.6/682.3 2.14 2020 3056.7/4345.9 0.7 2019 1192.2/900. 1.32 2019 1128.7/2205.5 0.51 2018 971.8/1240.4 0.78 2018 378.8/1626.2 0.23 ii) Acid-test ratio = Current assets - Inventories / Current liabilities ii) Debt to equity ratio = Total liabilities / Shareholder's equity 2020 1461.6-811.8/682 0.95 2020 3056.7/1289.2 2.37 2019 1192.2-763.8/900.5 0.48 2019 1128.7/1076.8 1.04 2018 971.8-478/1240.4 0.40 2018 378.8/774.7 0.49 iii) Cash ratio = Cash and Cash equivalents / Current Liabilities "ili) Interest coverage ratio = Operating income / Interest expenses 2020 465.9/682.3 0.68 2020 426.6/79.8 5.34 2019 251.2/900.5 0.2 2019 346.2/7.5 16.16 2018 347.5/1240.4 0.28 2018 295.9/2.0 147 I) Operating cash flow ratio = Operating cash flow / Current liabilities I) Debt service coverage ratio = Operating income / Total debt service 2020 854/682.3 1.25 2020 426.6/183.9 2.32 2019 377.6/900.5 0.42 2019 346.2/177.2 1.95 2018 338.8/1240.4 0.27 2018 295.9/374.1 0.69 Efficiency Ratios Profitability Ratios i Asset turnover ratio = Net sales / Average total assets i) Gross margin ratio = Gross profit / Net sales 2020 6110.8/2205.5+4345.9/2 = 6110.8/1613. 3.8 2020 2874.8/6110.8 0.47 2019 4717.8/1626.2+2205.5/2 =4717.8/1915.9 2.46 2019 2243.3/4717.8 0.47 2018 3161.4/714.1+1626.2 =3161.4/1170.1 2.7 2018 1531.6/3161.4 0.48 ii) Inventory turnover ratio = Cost of goods sold / Average inventory ii) Operating margin ratio = Operating income / Net sales 2020 3236/811.8+763.8/2 =3236/787.8 4.1 2020 426.6/6110.8 0.07 2019 2474.5/478+763.8/2=2474.5/620.9 3.98 or 4 2019 346.2/4717.8 0.07 2018 1629.8/348+478/2 = 1629.8/413 3.95 2018 295.9/3161.4 0.09 iii) Receivables turnover ratio = Net credit sales / Average accounts receivable iii) Return on assets ratio = Net income / Total assets 2020 6110.8/183.9+177.2/2 = 61 10.8/180.55 33.8 2020 229.2/4345.9 0.05 2019 4717.8/177.2+146.3/2 =4717.8/161.75 29.17 2019 263.4/2205.5 0.12 2018 3161.4/146.3+118.5/2 =3161.4/132.4 23.9 2018 236.4/1626.2 0.14 i) Days sales in inventory ratio = 365 days / Inventory turnover ratio i) Return on equity ratio = Net income / Shareholder's equity 2020 365/4.10 89 2020 229.2/1289.2 0.18 2019 365/4 91.25 2019 263.4/1076.8 0.24 2018 365/3.95 92 4 2018 236.4/774.7 0.3 Market Value (Investment) Ratios i Book value per share ratio = (Shareholder's equity - Preferred equity) / Total common shares outstanding 2020 1289200000/973233160 1.32 2019 1076800000/973233160 1.11 2018 774700000/973233160 0.8 ii) Dividend vield ratio = Dividend per share / Share price 2020 2800/833 3.36 2019 1.71/457.30 0.003 2018 1.63/372.10 0.004 iii) Earnings per share ratio = Net earnings / Total shares outstanding 2020 250700000/973233160 0.26 2019 264200000/973233160 0.27 2018 231900000/973233160 0.24 i) Price-earnings ratio = Share price / Earnings per share 2020 833/25.29 33 2019 457.30/26.90 18 2018 372.10/28.83 13

Step by Step Solution

There are 3 Steps involved in it

Step: 1

blur-text-image

Get Instant Access to Expert-Tailored Solutions

See step-by-step solutions with expert insights and AI powered tools for academic success

Step: 2

blur-text-image

Step: 3

blur-text-image

Ace Your Homework with AI

Get the answers you need in no time with our AI-driven, step-by-step assistance

Get Started

Recommended Textbook for

Financial Accounting Theory And Analysis Text And Cases

Authors: Richard G Schroeder, Myrtle W Clark, Jack M Cathey

13th Edition

1119577772, 9781119577775

More Books

Students also viewed these Accounting questions