

Answered step by step
Verified Expert Solution
Question
1 Approved Answer
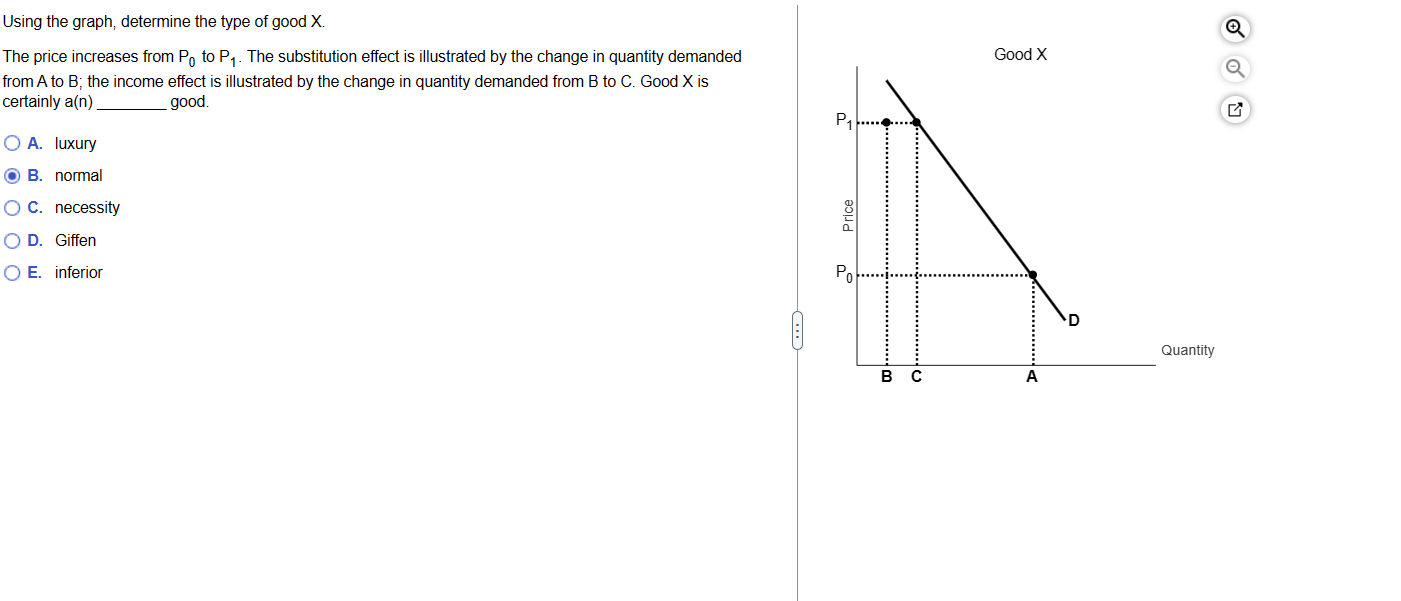
Using the graph, determine the type of good X. The price increases from P0 to P1. The substitution effect lS illustrated by the change in
Step by Step Solution
There are 3 Steps involved in it
Step: 1

Get Instant Access to Expert-Tailored Solutions
See step-by-step solutions with expert insights and AI powered tools for academic success
Step: 2

Step: 3
Ace Your Homework with AI
Get the answers you need in no time with our AI-driven, step-by-step assistance
Get Started
Plenitude The New Economics Of True Wealth
Authors: Juliet Schor
1st Edition
1594202540, 9781594202544