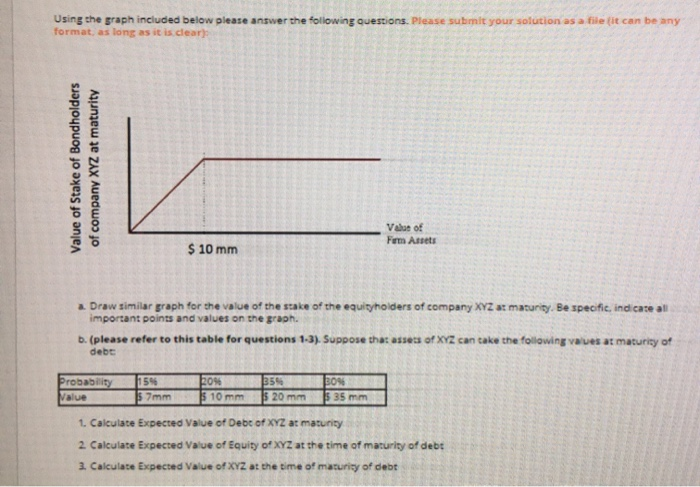
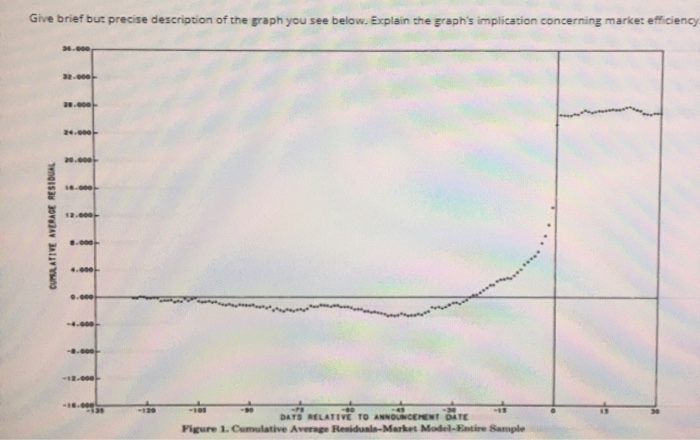
Using the graph included below please answer the following questions. Please submit your solution as a file it can be any format, as long as it is clear Value of Stake of Bondholders of company XYZ at maturity Value of Firm Annets $ 10 mm a Draw similar graph for the value of the stake of the equityholders of company XYZ : maturity. Be specific, indicate all important points and values on the graph. b. (please refer to this table for questions 1-3). Suppose tha: assess of XYZ can take the following valves at maturity of debt Probability Nalue 15% $ 7mm -0% $ 10 mm 359 $ 20 mm 30% 5 35 mm 1. Calculate Expected Value of Debt of XYZ at maturity 2. Calculate Expected Value of Equity of XYZ at the time of maturity of debt 3. Calculate Expected Value of XYZ at the time of maturity of debt Give brief bur precise description of the graph you see below. Explain the graph's implication concerning market efficiency 36.000 32.000 20.com 20.000 20.000 12.000 CUMULATIVE AVERAGE RESIDUAL 8.000 4.60 0.000 -0.000 -12.000 DATS RELATIVE TO ANNOUNCEMENT DATE Figure 1. Cumulative Average Residuals Market Model-Entire Sample Agree or disagree with the following statement, explain your reasoning: Reject projects with a NPV of zero, as your company is not going to earn any return on such investments For the toolbar, press ALT+F10 (PC) or ALT+FN+F10 (Mac). TT T Arial 3 (12pt) TE i 50 Using the graph included below please answer the following questions. Please submit your solution as a file it can be any format, as long as it is clear Value of Stake of Bondholders of company XYZ at maturity Value of Firm Annets $ 10 mm a Draw similar graph for the value of the stake of the equityholders of company XYZ : maturity. Be specific, indicate all important points and values on the graph. b. (please refer to this table for questions 1-3). Suppose tha: assess of XYZ can take the following valves at maturity of debt Probability Nalue 15% $ 7mm -0% $ 10 mm 359 $ 20 mm 30% 5 35 mm 1. Calculate Expected Value of Debt of XYZ at maturity 2. Calculate Expected Value of Equity of XYZ at the time of maturity of debt 3. Calculate Expected Value of XYZ at the time of maturity of debt Give brief bur precise description of the graph you see below. Explain the graph's implication concerning market efficiency 36.000 32.000 20.com 20.000 20.000 12.000 CUMULATIVE AVERAGE RESIDUAL 8.000 4.60 0.000 -0.000 -12.000 DATS RELATIVE TO ANNOUNCEMENT DATE Figure 1. Cumulative Average Residuals Market Model-Entire Sample Agree or disagree with the following statement, explain your reasoning: Reject projects with a NPV of zero, as your company is not going to earn any return on such investments For the toolbar, press ALT+F10 (PC) or ALT+FN+F10 (Mac). TT T Arial 3 (12pt) TE i 50