Question
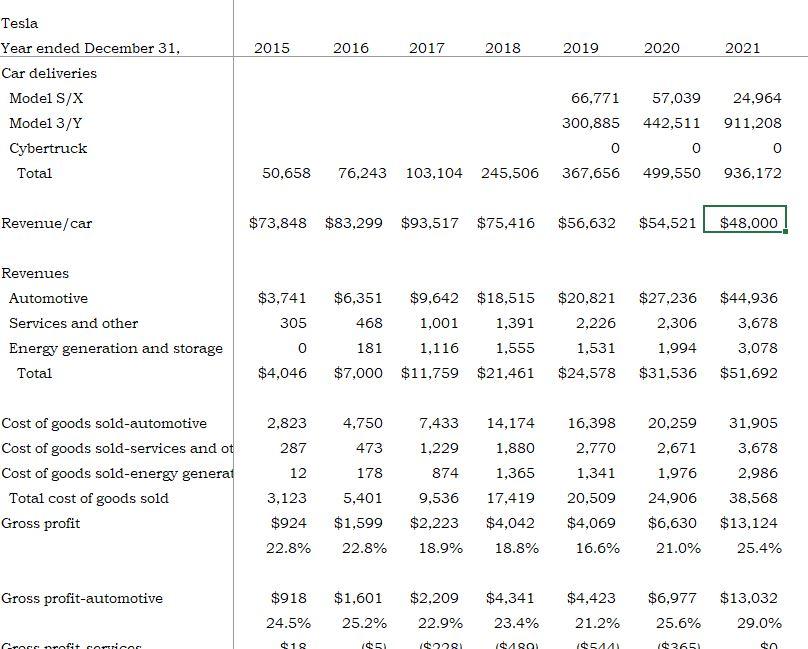
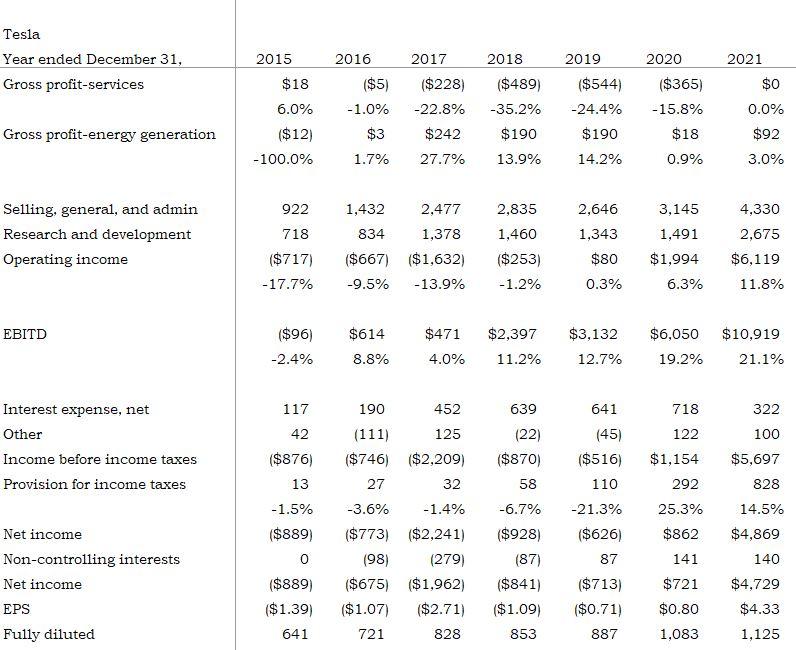
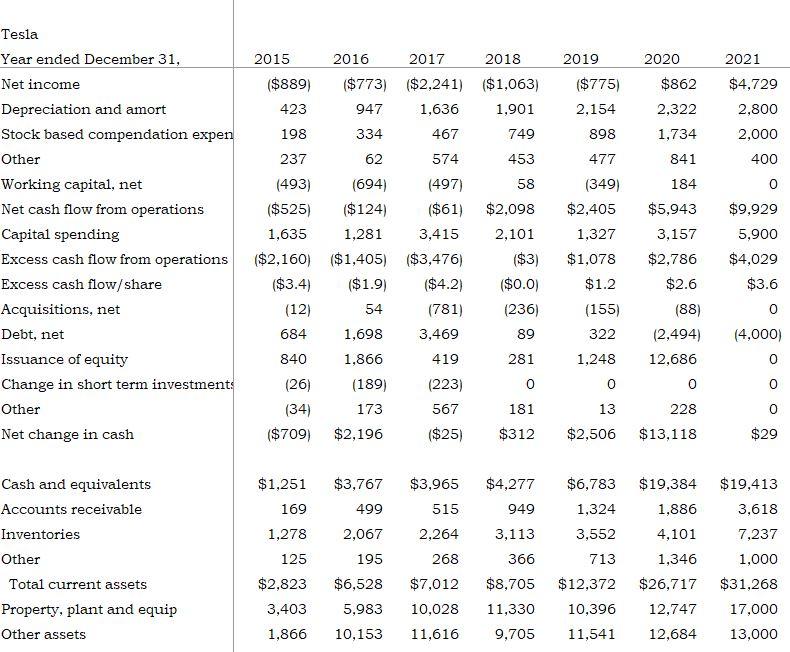
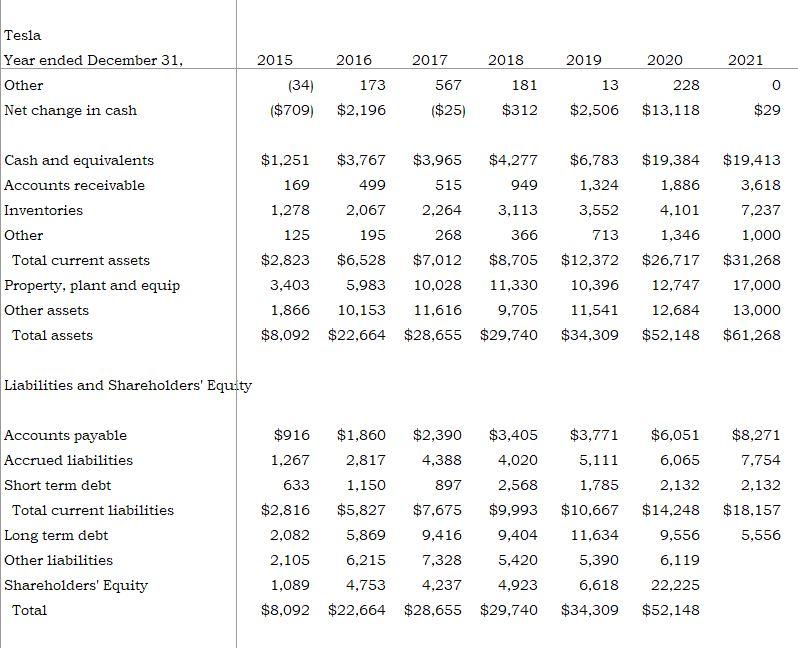
Using the historical financial statements included in the Excel file, value Tesla off of 2030 revenues and EBITD. Forecast its income statement, funds flow, and


Using the historical financial statements included in the Excel file, value Tesla off of 2030 revenues and EBITD. Forecast its income statement, funds flow, and balance sheet from 2022 through 2030 and then use these inputs to value Tesla. Utilizing historical cars shipped and revenue/car, forecast revenues and then apply an EBITD margin to your revenue estimate.
Based on your forecast for its income statement, funds flow statement, and balance sheet, value Tesla using both the DCF approach and a terminal EBITD multiple based on your 2030 EBITD estimate. Assume a 10% cost of capital. Is Tesla fairly valued, over-valued, or under-valued?
Compare your valuation estimate using a TMV/EBITD multiple to what you arrived at using a DCF valuation approach. If there is a material difference in value based on these two different approaches, what do you attribute this to?
2015 2016 2017 2018 2019 2020 2021 Tesla Year ended December 31, Car deliveries Model S/X Model 3/Y Cybertruck Total 66,771 300,885 57,039 442,511 0 24,964 911,208 0 936,172 0 50,658 76,243 103,104 245,506 367,656 499,550 Revenue/car $73,848 $83,299 $93,517 $75,416 $56,632 $54,521 $48,000 Revenues Automotive Services and other Energy generation and storage Total $6,351 468 $3,741 305 o $4,046 $9,642 $18,515 1,001 1,391 1,116 1,555 $44,936 3,678 $20,821 2,226 1,531 $24,578 $27,236 2,306 1,994 $31,536 181 3,078 $7,000 $11,759 $21,461 $51,692 2,823 4,750 7,433 16,398 20,259 31,905 14,174 1,880 287 473 1,229 2,770 3,678 Cost of goods sold-automotive Cost of goods sold-services and ot Cost of goods sold-energy generat Total cost of goods sold Gross profit 12 178 874 1,365 1,341 2,986 3,123 $924 22.8% 38,568 5,401 $1,599 9,536 $2,223 18.9% 17,419 $4,042 18.8% 2,671 1,976 24,906 $6,630 21.0% 20,509 $4,069 16.6% $13,124 25.4% 22.8% Gross profit-automotive $918 $4,341 $1,601 25.2% $2,209 22.9% $4,423 21.2% $6,977 25.6% $13,032 29.0% 24.5% 23.4% Croft er 18 1051 102081 1948 10544 10265 do Tesla Year ended December 31, Gross profit-services 2015 2016 2018 2019 2020 $18 6.0% ($12) -100.0% ($5) -1.0% $3 2017 ($228) -22.8% $242 27.7% ($489) -35.2% ($544) -24.4% $190 ($365) -15.8% $18 0.9% 2021 $0 0.0% $92 Gross profit-energy generation $190 13.9% 1.7% 14.2% 3.0% 922 2,835 Selling, general, and admin Research and development Operating income 2,646 1,343 3,145 1,491 718 ($717) -17.7% 1,432 2,477 834 1,378 ($667) ($1,632) -9.5% -13.9% 1,460 ($253) - 1.2% 4,330 2,675 $6,119 $1,994 $80 0.3% 6.3% 11.8% EBITD $6,050 ($96) -2.4% $614 8.8% $471 4.0% $2,397 11.2% $3,132 12.7% $10.919 21.1% 19.2% 117 190 452 639 641 718 322 122 Interest expense, net Other Income before income taxes Provision for income taxes 42 ($876) 13 (111) 125 ($746) $2,209) 27 32 $1,154 100 $5,697 828 292 25.3% -3.6% -1.4% 14.5% $4,869 (22) ($870) 58 -6.7% ($928) (87) ($841) ($1.09) 853 $862 (45) ($516) 110 -21.3% ($626) 87 ($713) ($0.71) 887 Net income Non-controlling interests Net income EPS Fully diluted 141 -1.5% ($889) 0 ($889) ($1.39) 641 140 ($773) ($2,241) (98) (279) ($675) ($1,962) ($1.07) ($2.71) 721 828 $721 $0.80 1,083 $4,729 $4.33 1,125 2016 2017 2018 2020 2015 ($889) 423 ($1,063) 1,901 749 2019 ($775) 2,154 2021 $4,729 2,800 2,000 198 898 237 453 477 400 0 (349) $2,405 $9,929 Tesla Year ended December 31, Net income Depreciation and amort Stock based compendation expen Other Working capital, net Net cash flow from operations Capital spending Excess cash flow from operations Excess cash flow/share Acquisitions, net Debt, net Issuance of equity Change in short term investments Other Net change in cash (493) ($525) 1,635 ($2,160) ($3.4) (12) 684 840 (26) (34) ($709) ($773) $2,241) 947 1,636 334 467 62 574 (694) (497) ($124) ($61) 1,281 3,415 ($1,405) ($3,476) ($1.9) $4.2) 54 (781) 1,698 3,469 1,866 419 (189) (223) 173 567 $2,196 ($25) 58 $2,098 2,101 ($3) ($0.0) (236) 89 1,327 $1,078 $1.2 (155) 322 $862 2,322 1,734 841 184 $5,943 3,157 $2,786 $2.6 (88) (2,494) 12,686 0 5,900 $4,029 $3.6 0 (4,000) 281 1,248 0 0 0 0 13 228 0 181 $312 $2,506 $13,118 $29 $3,767 $19,413 $1,251 169 $3,965 515 $4,277 949 $6,783 1,324 $19,384 1,886 499 3,618 2,264 3,113 3,552 4,101 7,237 Cash and equivalents Accounts receivable Inventories Other Total current assets Property, plant and equip Other assets 1,278 125 2,067 195 $6,528 268 366 713 1,346 $2,823 $7,012 10,028 11,616 $ 12,372 10,396 $8,705 11,330 9,705 $26,717 12,747 3,403 1,000 $31,268 17,000 5,983 1,866 10,153 11,541 12,684 13,000 Tesla 2016 2020 2021 Year ended December 31, Other Net change in cash 2015 (34) ($709) 2017 567 173 2018 181 $312 2019 13 $2,506 228 $2,196 ($25) $13,118 $29 $6,783 $19,384 1,886 $19,413 3,618 1,324 7,237 3,552 713 4,101 1,346 1,000 Cash and equivalents Accounts receivable Inventories Other Total current assets Property, plant and equip Other assets Total assets $1,251 $3,767 $3,965 $4,277 169 499 515 949 1,278 2,067 2,264 3,113 125 195 268 366 $2,823 $6,528 $7,012 $8,705 3,403 5,983 10,028 11,330 1,866 10,153 11,616 9,705 $8,092 $22,664 $28,655 $29,740 $26,717 $12,372 10,396 12,747 $31,268 17,000 13,000 $61,268 11,541 $34,309 12,684 $52,148 Liabilities and Shareholders' Equity $8,271 $3,771 5,111 7,754 2,132 Accounts payable Accrued liabilities Short term debt Total current liabilities Long term debt Other liabilities Shareholders' Equity Total $18.157 $916 $1,860 $2,390 $3,405 1,267 2,817 4,388 4,020 633 1,150 897 2,568 $2,816 $5,827 $7,675 $9,993 2,082 5,869 9,416 9,404 2,105 6,215 7,328 5,420 1,089 4,753 4,237 4,923 $8,092 $22,664 $28,655 $29,740 $6,051 6,065 2,132 $14,248 9,556 1,785 $10,667 11,634 5,390 5,556 6,618 6,119 22,225 $52,148 $34,309 2015 2016 2017 2018 2019 2020 2021 Tesla Year ended December 31, Car deliveries Model S/X Model 3/Y Cybertruck Total 66,771 300,885 57,039 442,511 0 24,964 911,208 0 936,172 0 50,658 76,243 103,104 245,506 367,656 499,550 Revenue/car $73,848 $83,299 $93,517 $75,416 $56,632 $54,521 $48,000 Revenues Automotive Services and other Energy generation and storage Total $6,351 468 $3,741 305 o $4,046 $9,642 $18,515 1,001 1,391 1,116 1,555 $44,936 3,678 $20,821 2,226 1,531 $24,578 $27,236 2,306 1,994 $31,536 181 3,078 $7,000 $11,759 $21,461 $51,692 2,823 4,750 7,433 16,398 20,259 31,905 14,174 1,880 287 473 1,229 2,770 3,678 Cost of goods sold-automotive Cost of goods sold-services and ot Cost of goods sold-energy generat Total cost of goods sold Gross profit 12 178 874 1,365 1,341 2,986 3,123 $924 22.8% 38,568 5,401 $1,599 9,536 $2,223 18.9% 17,419 $4,042 18.8% 2,671 1,976 24,906 $6,630 21.0% 20,509 $4,069 16.6% $13,124 25.4% 22.8% Gross profit-automotive $918 $4,341 $1,601 25.2% $2,209 22.9% $4,423 21.2% $6,977 25.6% $13,032 29.0% 24.5% 23.4% Croft er 18 1051 102081 1948 10544 10265 do Tesla Year ended December 31, Gross profit-services 2015 2016 2018 2019 2020 $18 6.0% ($12) -100.0% ($5) -1.0% $3 2017 ($228) -22.8% $242 27.7% ($489) -35.2% ($544) -24.4% $190 ($365) -15.8% $18 0.9% 2021 $0 0.0% $92 Gross profit-energy generation $190 13.9% 1.7% 14.2% 3.0% 922 2,835 Selling, general, and admin Research and development Operating income 2,646 1,343 3,145 1,491 718 ($717) -17.7% 1,432 2,477 834 1,378 ($667) ($1,632) -9.5% -13.9% 1,460 ($253) - 1.2% 4,330 2,675 $6,119 $1,994 $80 0.3% 6.3% 11.8% EBITD $6,050 ($96) -2.4% $614 8.8% $471 4.0% $2,397 11.2% $3,132 12.7% $10.919 21.1% 19.2% 117 190 452 639 641 718 322 122 Interest expense, net Other Income before income taxes Provision for income taxes 42 ($876) 13 (111) 125 ($746) $2,209) 27 32 $1,154 100 $5,697 828 292 25.3% -3.6% -1.4% 14.5% $4,869 (22) ($870) 58 -6.7% ($928) (87) ($841) ($1.09) 853 $862 (45) ($516) 110 -21.3% ($626) 87 ($713) ($0.71) 887 Net income Non-controlling interests Net income EPS Fully diluted 141 -1.5% ($889) 0 ($889) ($1.39) 641 140 ($773) ($2,241) (98) (279) ($675) ($1,962) ($1.07) ($2.71) 721 828 $721 $0.80 1,083 $4,729 $4.33 1,125 2016 2017 2018 2020 2015 ($889) 423 ($1,063) 1,901 749 2019 ($775) 2,154 2021 $4,729 2,800 2,000 198 898 237 453 477 400 0 (349) $2,405 $9,929 Tesla Year ended December 31, Net income Depreciation and amort Stock based compendation expen Other Working capital, net Net cash flow from operations Capital spending Excess cash flow from operations Excess cash flow/share Acquisitions, net Debt, net Issuance of equity Change in short term investments Other Net change in cash (493) ($525) 1,635 ($2,160) ($3.4) (12) 684 840 (26) (34) ($709) ($773) $2,241) 947 1,636 334 467 62 574 (694) (497) ($124) ($61) 1,281 3,415 ($1,405) ($3,476) ($1.9) $4.2) 54 (781) 1,698 3,469 1,866 419 (189) (223) 173 567 $2,196 ($25) 58 $2,098 2,101 ($3) ($0.0) (236) 89 1,327 $1,078 $1.2 (155) 322 $862 2,322 1,734 841 184 $5,943 3,157 $2,786 $2.6 (88) (2,494) 12,686 0 5,900 $4,029 $3.6 0 (4,000) 281 1,248 0 0 0 0 13 228 0 181 $312 $2,506 $13,118 $29 $3,767 $19,413 $1,251 169 $3,965 515 $4,277 949 $6,783 1,324 $19,384 1,886 499 3,618 2,264 3,113 3,552 4,101 7,237 Cash and equivalents Accounts receivable Inventories Other Total current assets Property, plant and equip Other assets 1,278 125 2,067 195 $6,528 268 366 713 1,346 $2,823 $7,012 10,028 11,616 $ 12,372 10,396 $8,705 11,330 9,705 $26,717 12,747 3,403 1,000 $31,268 17,000 5,983 1,866 10,153 11,541 12,684 13,000 Tesla 2016 2020 2021 Year ended December 31, Other Net change in cash 2015 (34) ($709) 2017 567 173 2018 181 $312 2019 13 $2,506 228 $2,196 ($25) $13,118 $29 $6,783 $19,384 1,886 $19,413 3,618 1,324 7,237 3,552 713 4,101 1,346 1,000 Cash and equivalents Accounts receivable Inventories Other Total current assets Property, plant and equip Other assets Total assets $1,251 $3,767 $3,965 $4,277 169 499 515 949 1,278 2,067 2,264 3,113 125 195 268 366 $2,823 $6,528 $7,012 $8,705 3,403 5,983 10,028 11,330 1,866 10,153 11,616 9,705 $8,092 $22,664 $28,655 $29,740 $26,717 $12,372 10,396 12,747 $31,268 17,000 13,000 $61,268 11,541 $34,309 12,684 $52,148 Liabilities and Shareholders' Equity $8,271 $3,771 5,111 7,754 2,132 Accounts payable Accrued liabilities Short term debt Total current liabilities Long term debt Other liabilities Shareholders' Equity Total $18.157 $916 $1,860 $2,390 $3,405 1,267 2,817 4,388 4,020 633 1,150 897 2,568 $2,816 $5,827 $7,675 $9,993 2,082 5,869 9,416 9,404 2,105 6,215 7,328 5,420 1,089 4,753 4,237 4,923 $8,092 $22,664 $28,655 $29,740 $6,051 6,065 2,132 $14,248 9,556 1,785 $10,667 11,634 5,390 5,556 6,618 6,119 22,225 $52,148 $34,309Step by Step Solution
There are 3 Steps involved in it
Step: 1

Get Instant Access to Expert-Tailored Solutions
See step-by-step solutions with expert insights and AI powered tools for academic success
Step: 2

Step: 3

Ace Your Homework with AI
Get the answers you need in no time with our AI-driven, step-by-step assistance
Get Started


