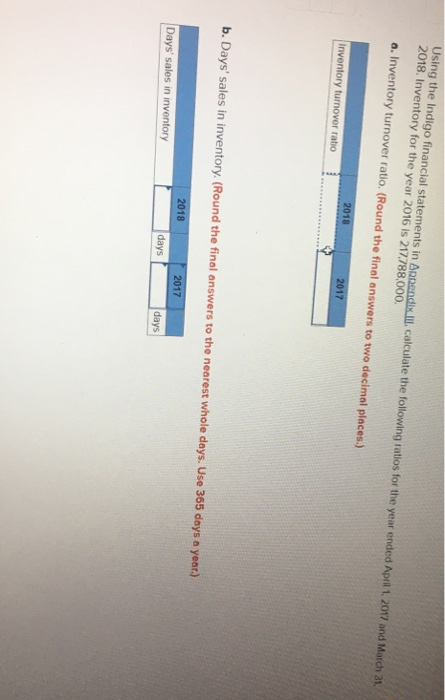
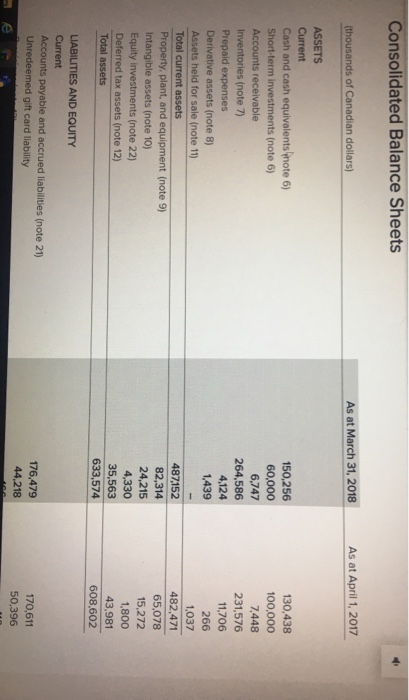
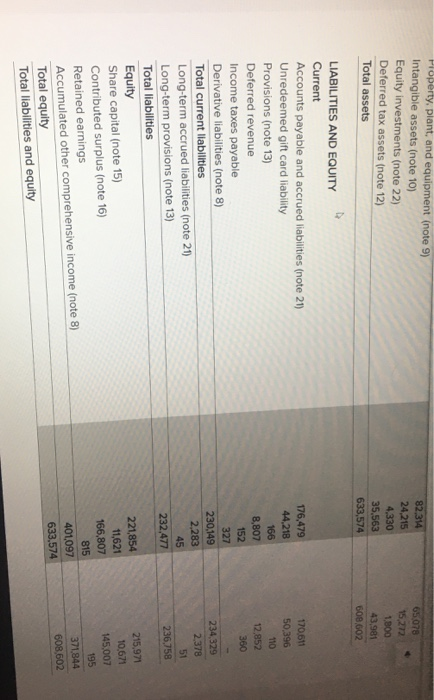
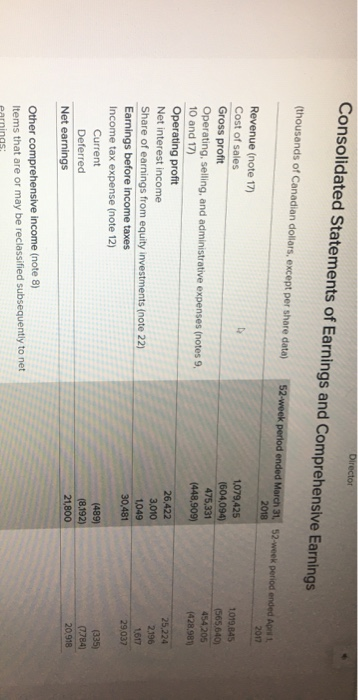
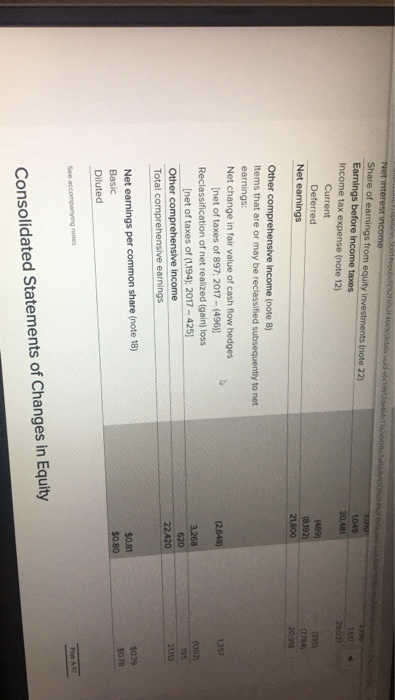
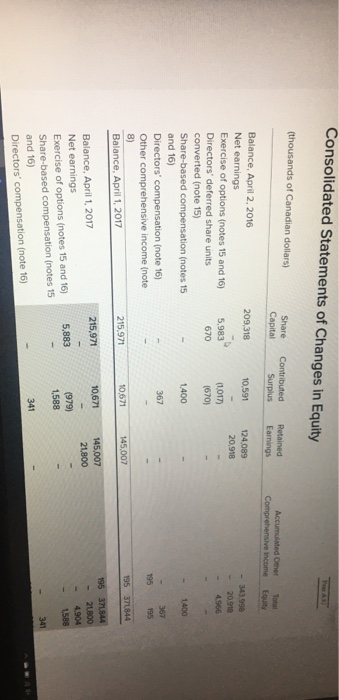
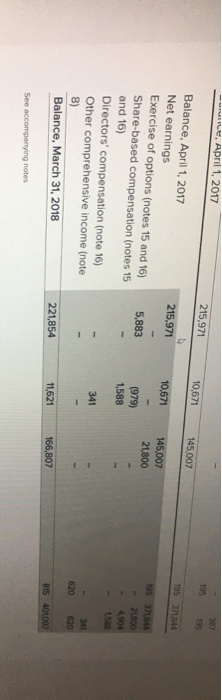
Using the Indigo financial statements in Appendix Ill, calculate the following ratios for the year ended April 1, 2017 and March 21 2018. Inventory for the year 2016 ls 217,788,000. a. Inventory turnover ratlo. (Round the final answers to two decimal places.) 2018 Inventory turnover ratio 2017 b. Days' sales in inventory. (Round the final answers to the nearest whole days. Use 365 days a year.) 2018 Days' sales in inventory 2017 days days Consolidated Balance Sheets (thousands of Canadian dollars) As at March 31, 2018 As at April 1, 2017 ASSETS Current Cash and cash equivalentsote 6) Short-term investments (note 6) Accounts receivable Inventories (note 7) Prepaid expenses Derivative assets (note 8) Assets held for sale (note 11) Total current assets Property, plant, and equipment (note 9) Intangible assets (note 10) Equity Investments (note 22) Deferred tax assets (note 12) Total assets 150,256 60,000 6,747 264,586 4,124 1,439 130,438 100,000 7,448 231,576 11,706 266 1,037 482,471 65,078 15,272 1,800 43,981 608,602 487,152 82,314 24,215 4,330 35,563 633,574 LIABILITIES AND EQUITY Current Accounts payable and accrued liabilities (note 21) Unredeemed gift card liability 176.479 44,218 170,611 50,396 Property, plant, and equipment (note 9) Intangible assets (note 10) Equity investments (note 22) Deferred tax assets (note 12) Total assets 82 314 24.215 4,330 35,563 633,574 65078 15,272 1,800 43,981 608,602 170,611 50,396 110 12,852 360 LIABILITIES AND EQUITY Current Accounts payable and accrued liabilities (note 21) Unredeemed gift card liability Provisions (note 13) Deferred revenue Income taxes payable Derivative liabilities (note 8) Total current liabilities Long-term accrued liabilities (note 21) Long-term provisions (note 13) Total liabilities Equity Share capital (note 15) Contributed surplus (note 16) Retained earnings Accumulated other comprehensive income (note 8) Total equity Total liabilities and equity 176,479 44,218 166 B,807 152 327 230,149 2,283 45 232,477 234,329 2378 51 236,758 221,854 11,621 166,807 815 401,097 633.574 215,971 10.671 145,007 195 371.844 608,602 Director Consolidated Statements of Earnings and Comprehensive Earnings (thousands of Canadian dollars, except per share data) 52-week period ended March 31, 52-week period ended Apr 1 2018 2017 1,079,425 (604,094 475.331 (448,909) 1019.845 (565640) 454 205 (428.989 Revenue (note 17) Cost of sales Gross profit Operating, selling, and administrative expenses (notes 9, 10 and 17) Operating profit Net interest income Share of earnings from equity investments (note 22) Earnings before income taxes Income tax expense (note 12) Current Deferred Net earnings 26,422 3,010 1049 30,481 25,224 2196 1617 29.037 (489) (8,192) 21,800 (335) (7784 20.918 Other comprehensive income (note 8) Items that are or may be reclassified subsequently to net Net interest income Share of earnings from equity Investments (note 22) Earnings before income taxes Income tax expense (note 12) Current Deferred Net earnings U 1049 30 481 1611 2003 (489) 18.192) 21,800 335 (1784 20,918 Other comprehensive Income (note 8) Items that are or may be reclassified subsequently to net earnings: Net change in fair value of cash flow hedges [net of taxes of 897: 2017 - (496)] Reclassification of net realized (gain) loss [net of taxes of (1194): 2017 - 425] Other comprehensive income Total comprehensive earnings 1357 (2,648) 3.268 620 22.420 (1362 195 21.11 $0.79 $078 $0.81 $0.80 Net earnings per common share (note 18) Basic Diluted See accompanying notes Consolidated Statements of Changes in Equity Consolidated Statements of Changes in Equity (thousands of Canadian dollars) Share Capital Contributed Surplus Retained Earnings Accumulated Omer Comprehensive income Total Equit, 209,318 10,591 124,089 20.918 343 990 20.910 4966 5,983 670 (1.017) (670) Balance, April 2, 2016 Net earnings Exercise of options (notes 15 and 16) Directors' deferred share units converted (note 15) Share-based compensation (notes 15 and 16) Directors' compensation (note 16) Other comprehensive income (note 8) Balance, April 1, 2017 1,400 1,400 367 367 195 195 215.971 10,671 145,007 195 371,844 215,971 10,671 145,007 21800 195 371844 21ROO 4904 1.588 5,883 Balance, April 1, 2017 Net earnings Exercise of options (notes 15 and 16) Share-based compensation (notes 15 and 16) Directors' compensation (note 16) (979) 1,588 341 341 -, April 1, 2017 215,971 195 35 195 10,671 145.007 19537844 215,971 10,671 145,007 21800 5,883 Balance, April 1, 2017 Net earnings Exercise of options (notes 15 and 16) Share-based compensation (notes 15 and 16) Directors' compensation (note 16) Other comprehensive income (note 8) Balance, March 31, 2018 (979) 1,588 195374 21300 4.904 BB 341 620 341 620 221,854 11,621 166,807 815 401097 See accompanying notes