

Answered step by step
Verified Expert Solution
Question
1 Approved Answer
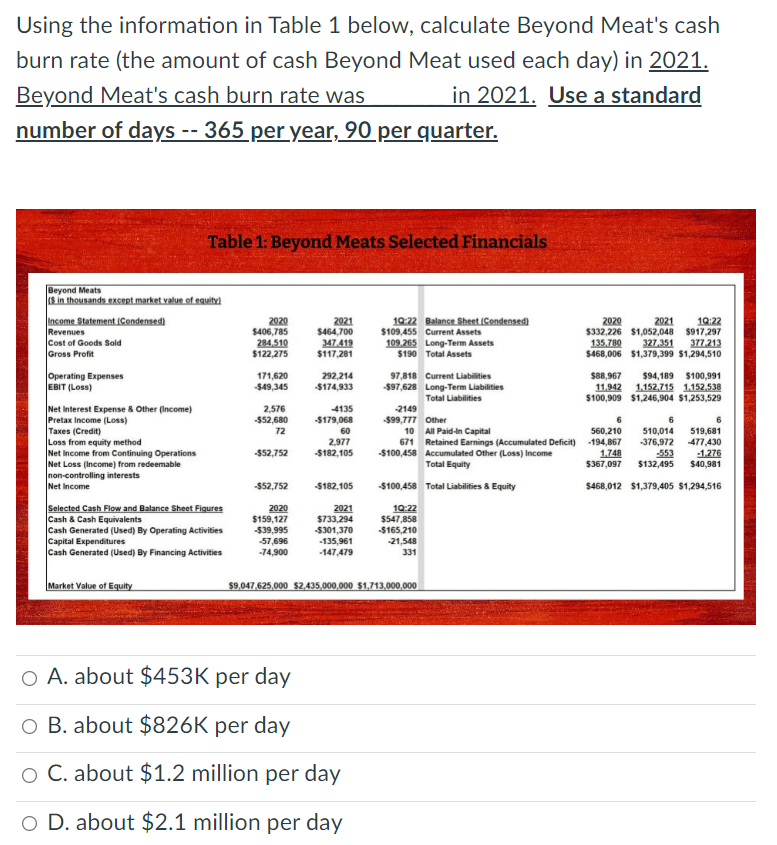
Using the information in Table 1 below, calculate Beyond Meat's cash burn rate (the amount of cash Beyond Meat used each day) in 2021. Beyond
Step by Step Solution
There are 3 Steps involved in it
Step: 1

Get Instant Access to Expert-Tailored Solutions
See step-by-step solutions with expert insights and AI powered tools for academic success
Step: 2

Step: 3
Ace Your Homework with AI
Get the answers you need in no time with our AI-driven, step-by-step assistance
Get Started
Generational Wealth Personal Financial Handbook
Authors: Sherique Dill
1st Edition
1985161222, 978-1985161221