

Question
Using the information listed in screen shot above, plot the opportunity set of risky assets in Excel. Then vary the correlation between stocks and bonds
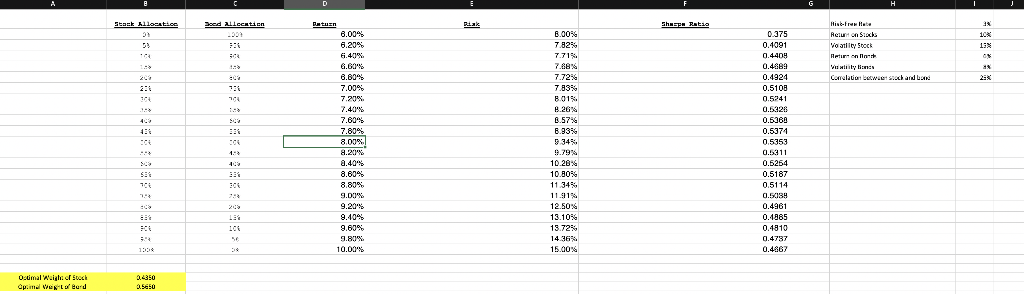
Using the information listed in screen shot above, plot the opportunity set of risky assets in Excel.
Then vary the correlation between stocks and bonds from + 1 to -1 and describe the changes in shape of the efficient frontier as you do so.
Upload the Excel file that contains the table & graph. Make sure to include in the Excel file submission, a description of the efficient frontier's shape as you vary the correlation
Stack Aldonation Soed Allocation Batuan Shuspa Ratus 22 NNNNN a Boa 2222 Soooo OSET Stack Aldonation Soed Allocation Batuan Shuspa Ratus 22 NNNNN a Boa 2222 Soooo OSETStep by Step Solution
There are 3 Steps involved in it
Step: 1

Get Instant Access to Expert-Tailored Solutions
See step-by-step solutions with expert insights and AI powered tools for academic success
Step: 2

Step: 3
Ace Your Homework with AI
Get the answers you need in no time with our AI-driven, step-by-step assistance
Get Started
Social Statistics For A Diverse Society
Authors: Chava Frankfort Nachmias, Anna Leon Guerrero
7th Edition
148333354X, 978-1506352060, 1506352065, 978-1483359687, 1483359689, 978-1483333540