Answered step by step
Verified Expert Solution
Question
1 Approved Answer
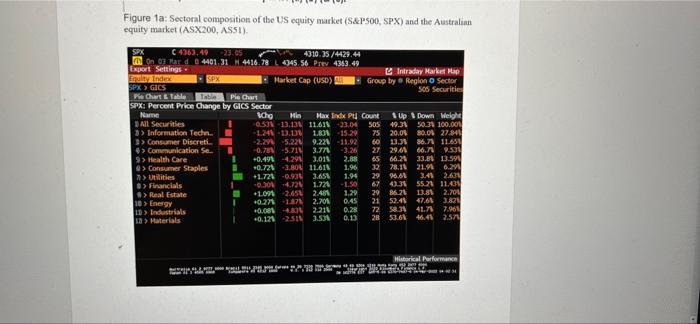
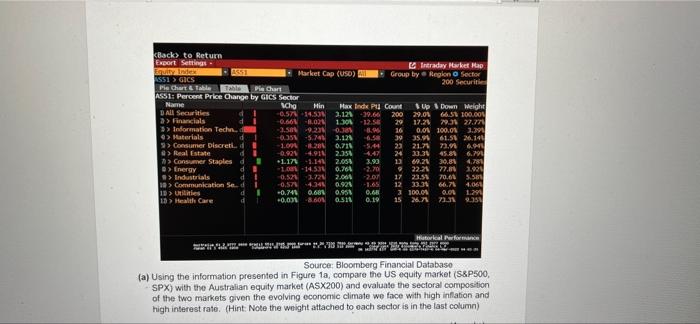
using the information presented in the figures1a , compare the US equity market(S&P500,SPX) with the Australian equity market (ASX200) and evaluate the sectoral composition of
using the information presented in the figures1a , compare the US equity market(S&P500,SPX) with the Australian equity market (ASX200) and evaluate the sectoral composition of the two markets given the evolving economic climate we face with high inflation and high interest rate.(Hint: Note the weight attached to each sector is in the last column. 

Figure 1a: Sectoral composition of the US equity market (S&P500, SPX) and the Australian equity market (ASX200, ASSI). C 4363.49 23.05 4310.35/4429.44 On 07 Mar d 0 4401.31 H 4416.78 4345.56 Prev 4363.49 Export Settings Equity Index SPX>GICS SPX Market Cap (USD) Intraday Market Hap Group by Region o Sector 505 Securities Pie Chart & Table Table Pie Chart Change by GICS Sector SPX: Percent Price Name Up&Down Weight All Securities 3> Information Techn.. schg Hin Max Indx Pt Count 053-13.13 11.618 23.04 505 -1.24-13.13 1.80 -15.29 > Consumer Discreti 50.3% 100.00% 80.0% 27.841 86.7 11.651 66.7 9.531 33.8% 13.59 21.9 6.291 > Communication Se... 9> Health Care > Consumer Staples 49.3% 75 20.0% -2.29 -5.22 9.22 -11.92 60 13.3% -0.78% -5.71 3.77 -3.26 27 29.0 +0.49% -4.291 3.011 2.88 65 66.2% +0.72% -3.80 11.61 1.96 32 78.11 +1.72 -0.93 3.658 1.94 29 96.61 -0.30% -4.72 1.724 -1.50 67 43.31 55.2 1.29 +1.091 -2.65 2.48 29 86.21 13.81 2.70 +0.27% -1.87 2.70% 0.45 21 52.41 47.6% 3.821 +0.001 4.33 0.28 2.21 72 58.3% 41.7 7.961 +0.12% -2.31 3.531 0.13 28 53.6% 46.4% 2.57 > Utilities 3.41 2.631 > Financials 11.43 > Real Estate 10> Energy 10 Industrials 13> Materials Historical Performance PAPLI* 1273 nyt sitt 1 Fe Back) to Return Export Settings - Equity Index AS51>GICS Market Cap (USD) Intraday Market Hap Sector 200 Securiti Pie Chart & Table Table Pie Chart ASS1: Percent Price Change by GICS Sector Name All Securities Up&Down Weight 29.01 66.58 100.00 17.2 3> Financials 3> Information Techn. 79.3% 27.77 3.391 4> Materials > Consumer Discreti, d > Real Estate Real Ent Scho Min Max Inde Pt Count -0.57% -14.53% 2.12% -39.66 200 -0.66% -8.02% 1.30 -12.58 29 -3.50 -9.23 -0.381 8.96 16 3.12% -0.35% -5.741 -6.58 64 39 35.94 Meh -1.094 8.28 0.71 -5.44 -0.92% -4.911 2.35% 4.47 34 24 +1.17% +1.14 2.05% -1.00-14.53 -0.52% -3.72 -0.57% 4.34 -0.74 0.68 +0,031 -8.60 23 21.71 33.34 12 24 40 > Consumer Staples d >Energy >Industrials 3,93 13 2.70 9 0.0% 100.0% 100 61.5% 26.14 nom 73.9 6.9 WAW 45.89 6.79 69.21 30.81 4,781 22.21 77.8% 1.921 17 23.5% 70.68 5.581 12 33.3% 66.7% 4.061 3 100.0% 0.00 1.291 15 26.7% 73.31 9.35 d di 0.76% 2.061 0.921 -1.65 0.95% 0.68 0.518 0.19 19> Communication Sedi 10>Utilities d1 di 10 Health Care Historical Performance **ALFAFARZZ. Source: Bloomberg Financial Database (a) Using the information presented in Figure 1a, compare the US equity market (S&P500, SPX) with the Australian equity market (ASX200) and evaluate the sectoral composition. of the two markets given the evolving economic climate we face with high inflation and high interest rate. (Hint: Note the weight attached to each sector is in the last column) 4551 Group by Region Figure 1a: Sectoral composition of the US equity market (S&P500, SPX) and the Australian equity market (ASX200, ASSI). C 4363.49 23.05 4310.35/4429.44 On 07 Mar d 0 4401.31 H 4416.78 4345.56 Prev 4363.49 Export Settings Equity Index SPX>GICS SPX Market Cap (USD) Intraday Market Hap Group by Region o Sector 505 Securities Pie Chart & Table Table Pie Chart Change by GICS Sector SPX: Percent Price Name Up&Down Weight All Securities 3> Information Techn.. schg Hin Max Indx Pt Count 053-13.13 11.618 23.04 505 -1.24-13.13 1.80 -15.29 > Consumer Discreti 50.3% 100.00% 80.0% 27.841 86.7 11.651 66.7 9.531 33.8% 13.59 21.9 6.291 > Communication Se... 9> Health Care > Consumer Staples 49.3% 75 20.0% -2.29 -5.22 9.22 -11.92 60 13.3% -0.78% -5.71 3.77 -3.26 27 29.0 +0.49% -4.291 3.011 2.88 65 66.2% +0.72% -3.80 11.61 1.96 32 78.11 +1.72 -0.93 3.658 1.94 29 96.61 -0.30% -4.72 1.724 -1.50 67 43.31 55.2 1.29 +1.091 -2.65 2.48 29 86.21 13.81 2.70 +0.27% -1.87 2.70% 0.45 21 52.41 47.6% 3.821 +0.001 4.33 0.28 2.21 72 58.3% 41.7 7.961 +0.12% -2.31 3.531 0.13 28 53.6% 46.4% 2.57 > Utilities 3.41 2.631 > Financials 11.43 > Real Estate 10> Energy 10 Industrials 13> Materials Historical Performance PAPLI* 1273 nyt sitt 1 Fe Back) to Return Export Settings - Equity Index AS51>GICS Market Cap (USD) Intraday Market Hap Sector 200 Securiti Pie Chart & Table Table Pie Chart ASS1: Percent Price Change by GICS Sector Name All Securities Up&Down Weight 29.01 66.58 100.00 17.2 3> Financials 3> Information Techn. 79.3% 27.77 3.391 4> Materials > Consumer Discreti, d > Real Estate Real Ent Scho Min Max Inde Pt Count -0.57% -14.53% 2.12% -39.66 200 -0.66% -8.02% 1.30 -12.58 29 -3.50 -9.23 -0.381 8.96 16 3.12% -0.35% -5.741 -6.58 64 39 35.94 Meh -1.094 8.28 0.71 -5.44 -0.92% -4.911 2.35% 4.47 34 24 +1.17% +1.14 2.05% -1.00-14.53 -0.52% -3.72 -0.57% 4.34 -0.74 0.68 +0,031 -8.60 23 21.71 33.34 12 24 40 > Consumer Staples d >Energy >Industrials 3,93 13 2.70 9 0.0% 100.0% 100 61.5% 26.14 nom 73.9 6.9 WAW 45.89 6.79 69.21 30.81 4,781 22.21 77.8% 1.921 17 23.5% 70.68 5.581 12 33.3% 66.7% 4.061 3 100.0% 0.00 1.291 15 26.7% 73.31 9.35 d di 0.76% 2.061 0.921 -1.65 0.95% 0.68 0.518 0.19 19> Communication Sedi 10>Utilities d1 di 10 Health Care Historical Performance **ALFAFARZZ. Source: Bloomberg Financial Database (a) Using the information presented in Figure 1a, compare the US equity market (S&P500, SPX) with the Australian equity market (ASX200) and evaluate the sectoral composition. of the two markets given the evolving economic climate we face with high inflation and high interest rate. (Hint: Note the weight attached to each sector is in the last column) 4551 Group by Region 

Step by Step Solution
There are 3 Steps involved in it
Step: 1

Get Instant Access to Expert-Tailored Solutions
See step-by-step solutions with expert insights and AI powered tools for academic success
Step: 2

Step: 3

Ace Your Homework with AI
Get the answers you need in no time with our AI-driven, step-by-step assistance
Get Started


