Using the listed ratios, perform ratio analysis on company's balance sheet.
Give a short explanation of your conclusions about the company after each category of ratios (i.e. How liquid is the company? How efficiently is it using the assets? etc.).
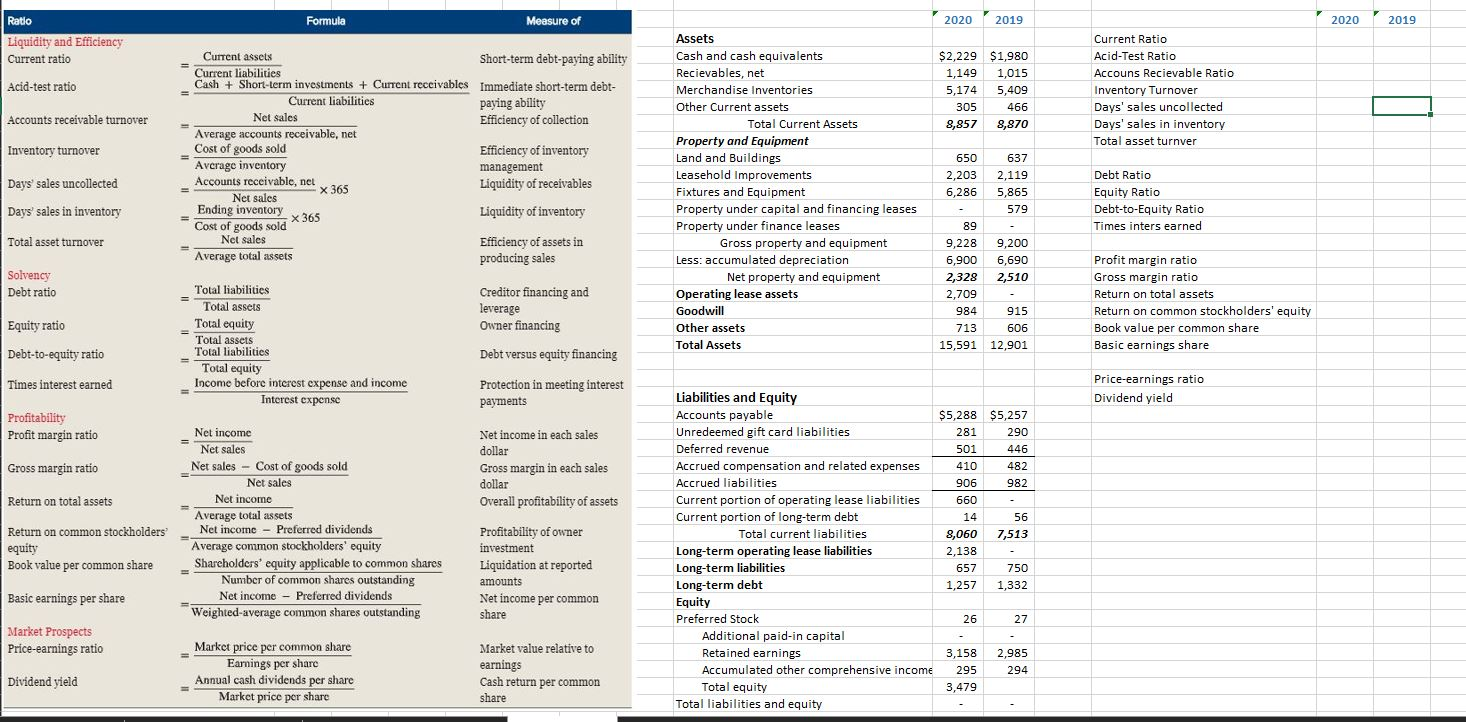
Ratio Formula Measure of 2020 2019 2020 2019 Liquidity and Efficiency Current ratio Acid-test ratio $2,229 $1,980 1,149 1,015 5,174 5,409 305 466 8,857 8,870 Current Ratio Acid-Test Ratio Accouns Recievable Ratio Inventory Turnover Days' sales uncollected Days' sales in inventory Total asset turnver Accounts receivable turnover Inventory turnover Current assets Short-term debt-paying ability Current liabilities Cash + Short-term investments + Current receivables Immediate short-term debt- Current liabilities paying ability Net sales Efficiency of collection Average accounts receivable, net Cost of goods sold Efficiency of inventory Average inventory management Accounts receivable, net x 365 Liquidity of receivables Net sales Ending inventory x 365 Liquidity of inventory Cost of goods sold Net sales Efficiency of assets in Average total assets producing sales Days' sales uncollected Assets Cash and cash equivalents Recievables, net Merchandise Inventories Other Current assets Total Current Assets Property and Equipment Land and Buildings Leasehold Improvements Fixtures and Equipment Property under capital and financing leases Property under finance leases Gross property and equipment Less: accumulated depreciation Net property and equipment Operating lease assets Goodwill Other assets Total Assets Debt Ratio Equity Ratio Debt-to-Equity Ratio Times inters earned Days' sales in inventory Total asset turnover 650 637 2,203 2,119 6,286 5,865 579 89 9,228 9,200 6,900 6,690 2,328 2,510 2,709 984 915 713 606 15,591 12,901 Solvency Debt ratio Creditor financing and leverage Owner financing Profit margin ratio Gross margin ratio Return on total assets Return on common stockholders' equity Book value per common share Basic earnings share Total liabilities Total assets Total equity Total assets Total liabilities Total equity Income before interest expense and income Interest expense Equity ratio Debt-to-equity ratio Debt versus equity financing Times interest earned Protection in meeting interest payments Price-earnings ratio Dividend yield Profitability Profit margin ratio Gross margin ratio Net income in each sales dollar Gross margin in each sales dollar Overall profitability of assets Return on total assets Net income Net sales Net sales - Cost of goods sold Net sales Net income Average total assets Net income - Preferred dividends Average common stockholders' equity Shareholders' equity applicable to common shares Number of common shares outstanding Net income - Preferred dividends Weighted average common shares outstanding Return on common stockholders equity Book value per common share Profitability of owner investment Liquidation at reported amounts Net income per common share Liabilities and Equity Accounts payable $5,288 $5,257 Unredeemed gift card liabilities 281 290 Deferred revenue 501 446 Accrued compensation and related expenses 410 482 Accrued liabilities 906 982 Current portion of operating lease liabilities 660 Current portion of long-term debt 14 56 Total current liabilities 8,060 7,513 Long-term operating lease liabilities 2,138 Long-term liabilities 657 750 Long-term debt 1,257 1,332 Equity Preferred Stock 26 27 Additional paid-in capital Retained earnings 3,158 2,985 Accumulated other comprehensive income 295 294 Total equity 3,479 Total liabilities and equity Basic earnings per share Market Prospects Price-earnings ratio Market price per common share Earnings per share Annual cash dividends per share Market price per share Dividend yield Market value relative to earnings Cash return per common share