Question
Using the output above, answer the following questions: i. Discuss on the normality for each variables ii. Briefly comment and explain on the scatter plot


Using the output above, answer the following questions:
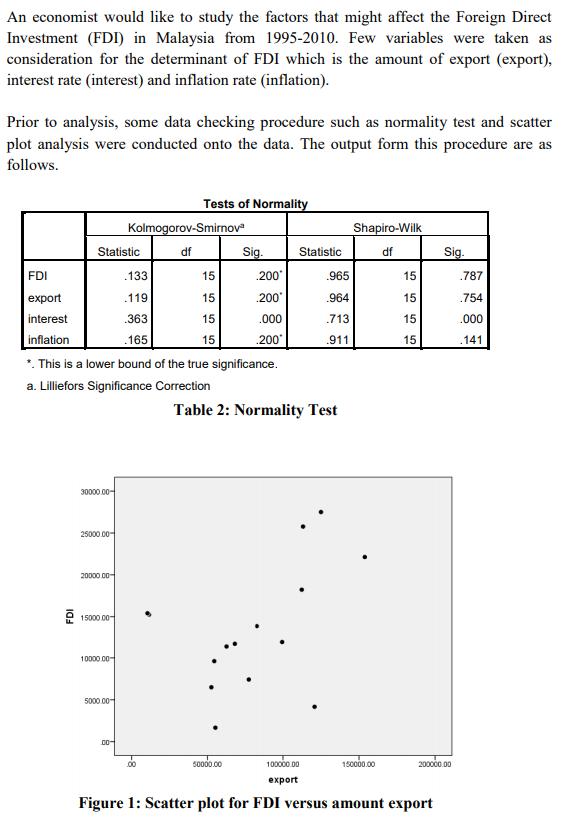
i. Discuss on the normality for each variables
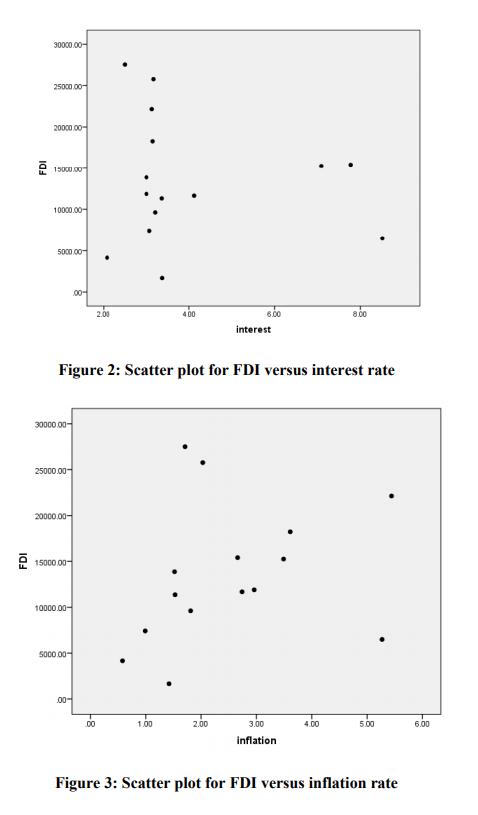
ii. Briefly comment and explain on the scatter plot obtained in Figure 1, Figure 2 and Figure 3
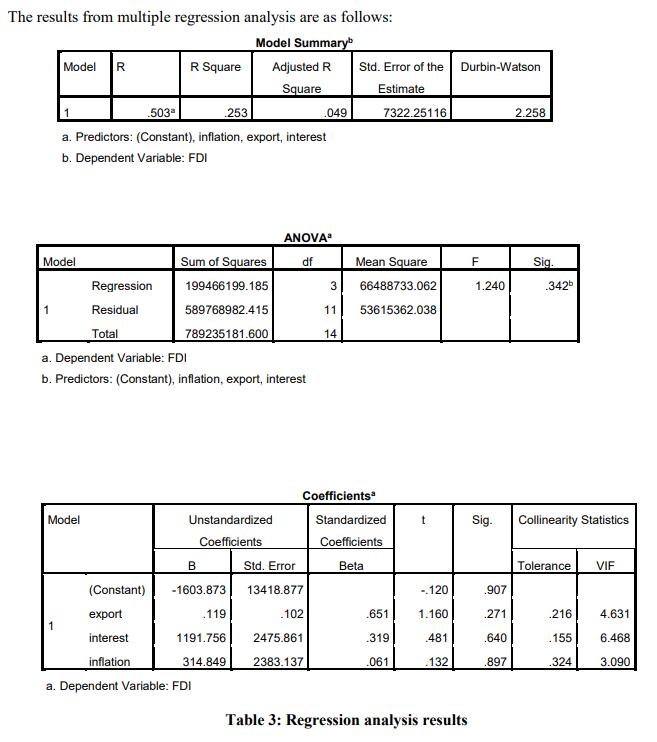
iii. Based on the ANOVA table, briefly explain on the significance of the model.
iv. Discuss on the significance of each variable.
v. Briefly explain whether multicollinearity occurs in the regression model or not. If yes, suggest a variable that need to be omitted.
vi. Interpret the value for the coefficient of determination, R2
An economist would like to study the factors that might affect the Foreign Direct Investment (FDI) in Malaysia from 1995-2010. Few variables were taken as consideration for the determinant of FDI which is the amount of export (export), interest rate (interest) and inflation rate (inflation). Prior to analysis, some data checking procedure such as normality test and scatter plot analysis were conducted onto the data. The output form this procedure are as follows. Tests of Normality Kolmogorov-Smirnove Shapiro-Wilk Statistic df Sig. Statistic df Sig. FDI .133 15 200" .965 15 .787 export .119 15 .200 .964 15 .754 interest .363 15 .000 .713 15 .000 inflation *. This is a lower bound of the true significance. .165 15 .200 .911 15 .141 a. Lilliefors Significance Correction Table 2: Normality Test 30000.00- 25000 00- 20000 00- e 15000 00 10000 00- 5000 00 00 50000.00 100000.00 150000.00 200000.00 export Figure 1: Scatter plot for FDI versus amount export
Step by Step Solution
3.36 Rating (168 Votes )
There are 3 Steps involved in it
Step: 1
i H 0 FDI is distributed normally H 1 FDI is not normally distributed From the test of normality output for both the tests KolmogorovSmirnov and SahpiroWilk test the pvalue corresponding to FDI 0200 a...
Get Instant Access to Expert-Tailored Solutions
See step-by-step solutions with expert insights and AI powered tools for academic success
Step: 2

Step: 3

Ace Your Homework with AI
Get the answers you need in no time with our AI-driven, step-by-step assistance
Get Started


