Question
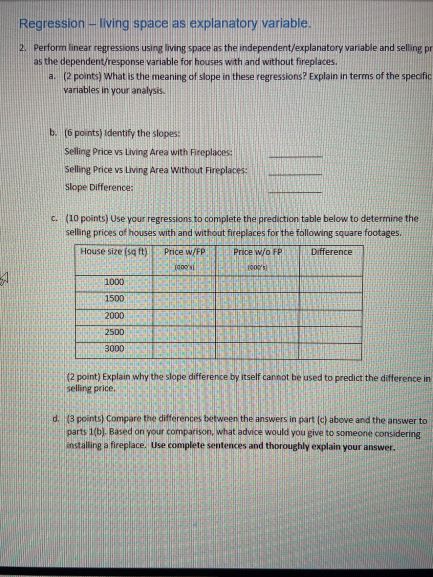
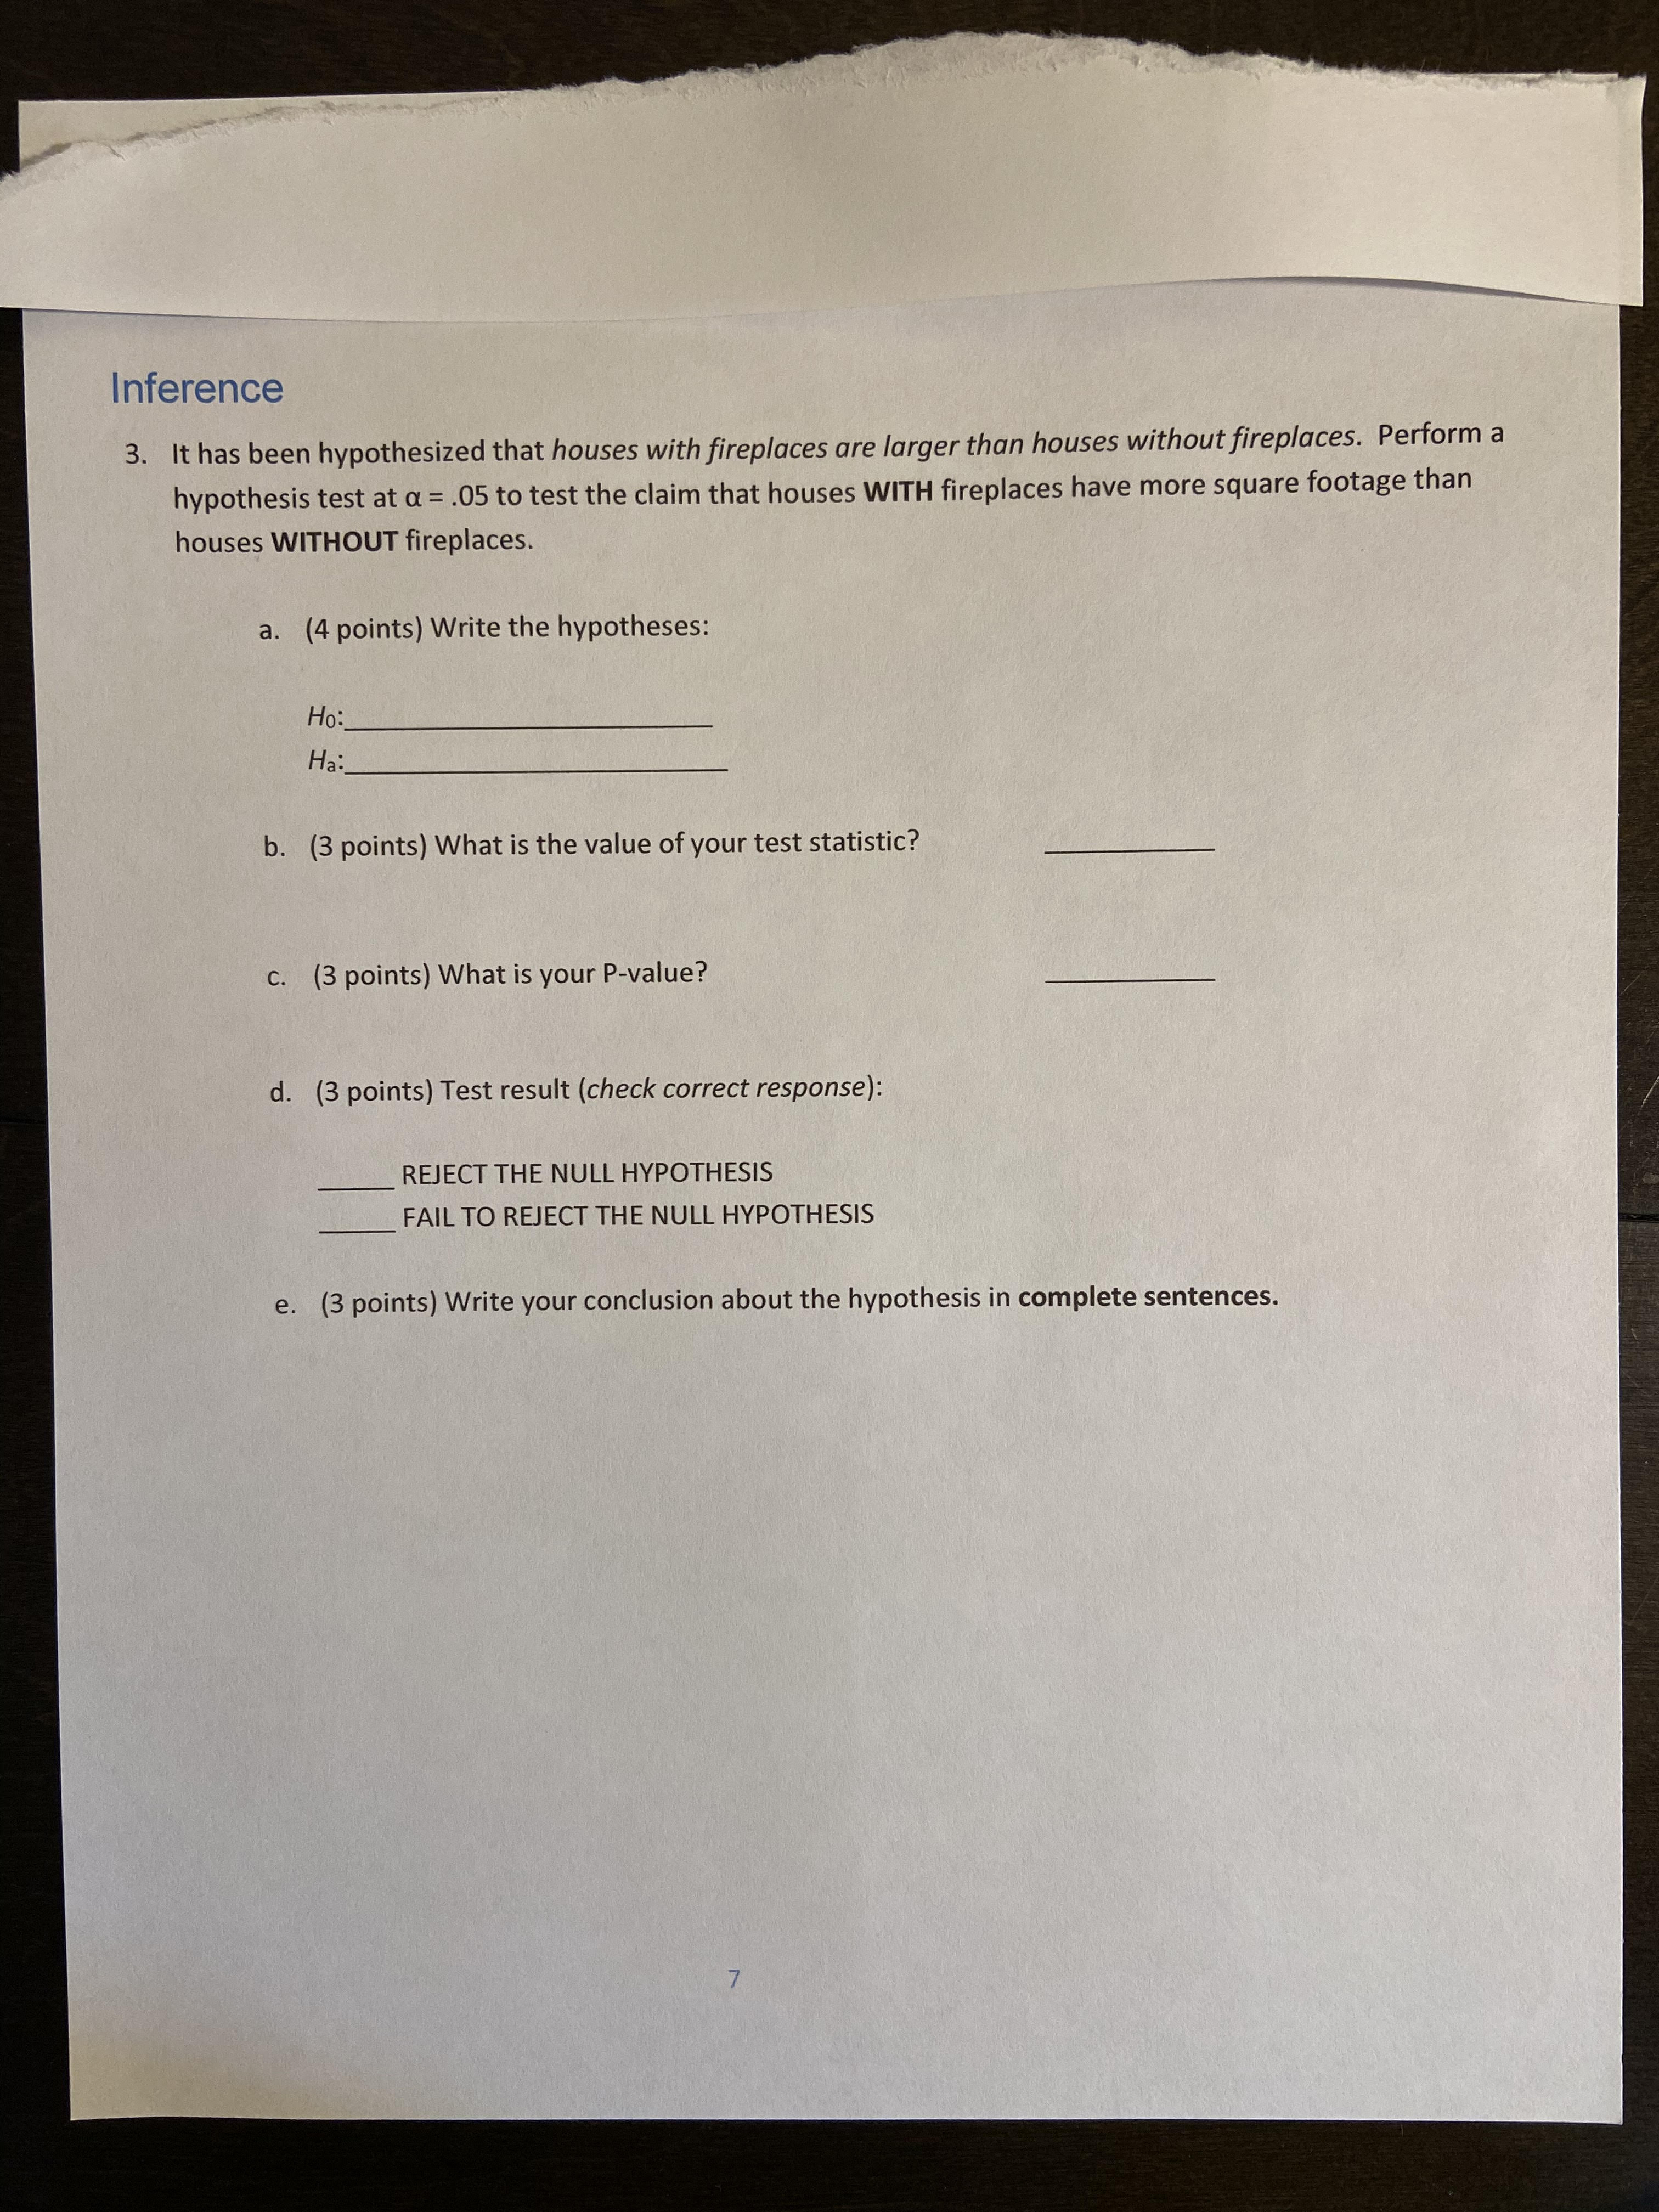
Using the photo below and this link of my spreadsheet please assist with Linear Regression. Question 1,2 (a-d) and 3 (a-e). Nearly 60% of the
Using the photo below and this link of my spreadsheet please assist with Linear Regression. Question 1,2 (a-d) and 3 (a-e).
Nearly 60% of the houses in
Saratoga County New York have fireplaces. On average, those houses sell for
about $65,000 more than houses without fireplaces. The goal is to answer the
question: Is
the fireplace the reason for the difference?
Resource:
The data set consists of a
random sample of 1728 homes in Saratoga County, NY taken from public
records.The data file is on Blackboard.
Computer Resource: Microsoft
Excel.
1.Create
side-by-side boxplots to compare selling price for houses with and without
fireplaces.
a.(3
points) Do the boxplots indicate that houses with fireplaces sell for a higher
price? Explain
what boxplot features you used to support your answer choice.
Yes
No
b.(6
points) Find the means and the difference in means.
DataMean
Selling Price with
Fireplaces:$270,552.32
Selling Price Without
Fireplaces:$133,746.99
Difference:$136,805.33
c.(3
points) Can you conclude that the presence of a fireplace adds to the
difference found in part (b) to the selling price of a house? Explain
your reasoning.YesNo
d.(3
points) If you were selling a house, would you pay to install a
fireplace?Yes
No
i.If
no, explain why you would not install a fireplace.
ii.If
yes, how much would you be willing to pay? Make sure to explain your choice.
iii.
e. (3 points) Identify other
possible reasons for the difference in the mean selling prices?
Please assist with the Inference question via photo above and accompanying link.
Specifically question 3
(a-e).
***PLEASE KEEP IN MIND AND OF NOTE--> This is (T-critical
Value that I am looking for. NOT the Z-Critical Value). ***
Link:
https://docs.google.com/spreadsheets/d/e/2PACX-1vTf6uQyLx1-vkV0d6A8y2m7BABk8IHPAOYE5cjY4bTuSy1e8fbyAsW1S5sSe_AI9g/pub?output=xlsx
Source:
The data set consists of a
random sample of 1728 homes in
Saratoga County, NY taken
from public records.


Step by Step Solution
There are 3 Steps involved in it
Step: 1

Get Instant Access to Expert-Tailored Solutions
See step-by-step solutions with expert insights and AI powered tools for academic success
Step: 2

Step: 3

Ace Your Homework with AI
Get the answers you need in no time with our AI-driven, step-by-step assistance
Get Started


