

Question
Using the picture below, solve parts I-IIIII) state the null hypothesis and alternative hypothesis which is correct?a. H0:u1=u2; Ha: u1#u2b. H0:u1=u2; ha:u1u2II) identify the p
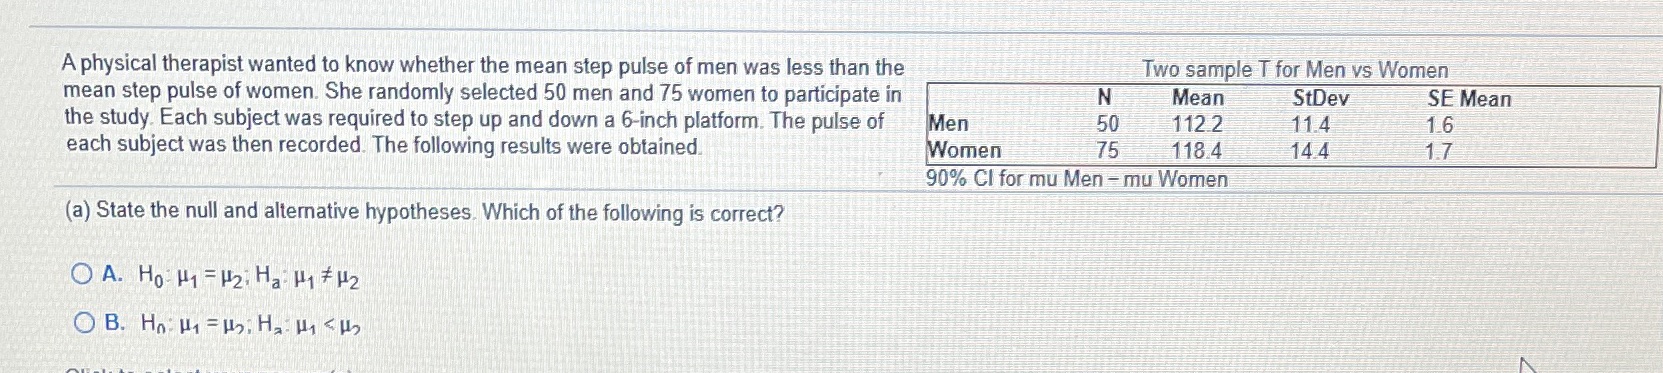
Using the picture below, solve parts I-IIIII) state the null hypothesis and alternative hypothesis which is correct?a. H0:u1=u2; Ha: u1#u2b. H0:u1=u2; ha:u1u2II) identify the p value III) state the researchers conclusion which is correcta. Fail to reject H0, there is not sufficient evidence to conclude that the mean step pulse of men was less than the mean step pulse of womenb. Fail to reject H0, there is sufficient evidence to conclude that the mean step pulse of men was less than the mean step pulse of womenC. Reject H0, there is not sufficient evidence to conclude that the mean step pulse of men was less than the mean step pulse of womend. Reject H0, there is sufficient evidence-to conclude that the mean step pulse of men was less than the mean step pulse of womenIIII) what is the 90% confidence interval for the mean difference in pulse rates of men versus women? The lower bound is ___The upper bound is ___(Round to two decimal places)Interpret the result a. We are 90% confident that the mean difference is the confidence interval b. 90% of the time the mean difference is the confidence intervalc. We are 90% confident that the means are in the confidence interval d. 90% of the time the means are in the confidence interval
Step by Step Solution
There are 3 Steps involved in it
Step: 1

Get Instant Access to Expert-Tailored Solutions
See step-by-step solutions with expert insights and AI powered tools for academic success
Step: 2

Step: 3
Ace Your Homework with AI
Get the answers you need in no time with our AI-driven, step-by-step assistance
Get Started
Advanced Engineering Mathematics
Authors: ERWIN KREYSZIG
9th Edition
0471488852, 978-0471488859