Question
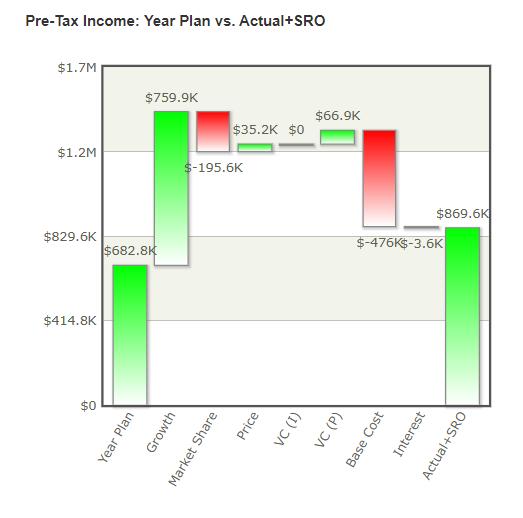
Using the Pre-Tax Net Income (Plan vs Actual + SRO) Walk Chart, identify three variances and explain the key drivers. Provide data to support your
Using the Pre-Tax Net Income (Plan vs Actual + SRO) Walk Chart, identify three variances and explain the key drivers. Provide data to support your explanations.

Pre-Tax Income: Year Plan vs. Actual+SRO $1.7M $1.2M $829.6K $682.8K $414.8K $0 $759.9K $66.9K $35.2K $0 $-195.6K Year Plan Growth Market Share Price (1) $-476K$-3.6K VC (P) Base Cost Interest Actual+SRO $869.6K
Step by Step Solution
There are 3 Steps involved in it
Step: 1
Based on the PreTax Net Income Plan vs Actual SRO Walk Chart here are three identified variances alo...
Get Instant Access to Expert-Tailored Solutions
See step-by-step solutions with expert insights and AI powered tools for academic success
Step: 2

Step: 3

Ace Your Homework with AI
Get the answers you need in no time with our AI-driven, step-by-step assistance
Get StartedRecommended Textbook for
Statistics Informed Decisions Using Data
Authors: Michael Sullivan III
5th Edition
978-0134135373, 134133536, 134135377, 978-0134133539
Students also viewed these Finance questions
Question
Answered: 1 week ago
Question
Answered: 1 week ago
Question
Answered: 1 week ago
Question
Answered: 1 week ago
Question
Answered: 1 week ago
Question
Answered: 1 week ago
Question
Answered: 1 week ago
Question
Answered: 1 week ago
Question
Answered: 1 week ago
Question
Answered: 1 week ago
Question
Answered: 1 week ago
Question
Answered: 1 week ago
Question
Answered: 1 week ago
Question
Answered: 1 week ago
Question
Answered: 1 week ago
Question
Answered: 1 week ago
Question
Answered: 1 week ago
Question
Answered: 1 week ago
Question
Answered: 1 week ago
Question
Answered: 1 week ago
Question
Answered: 1 week ago
View Answer in SolutionInn App


