Answered step by step
Verified Expert Solution
Question
1 Approved Answer
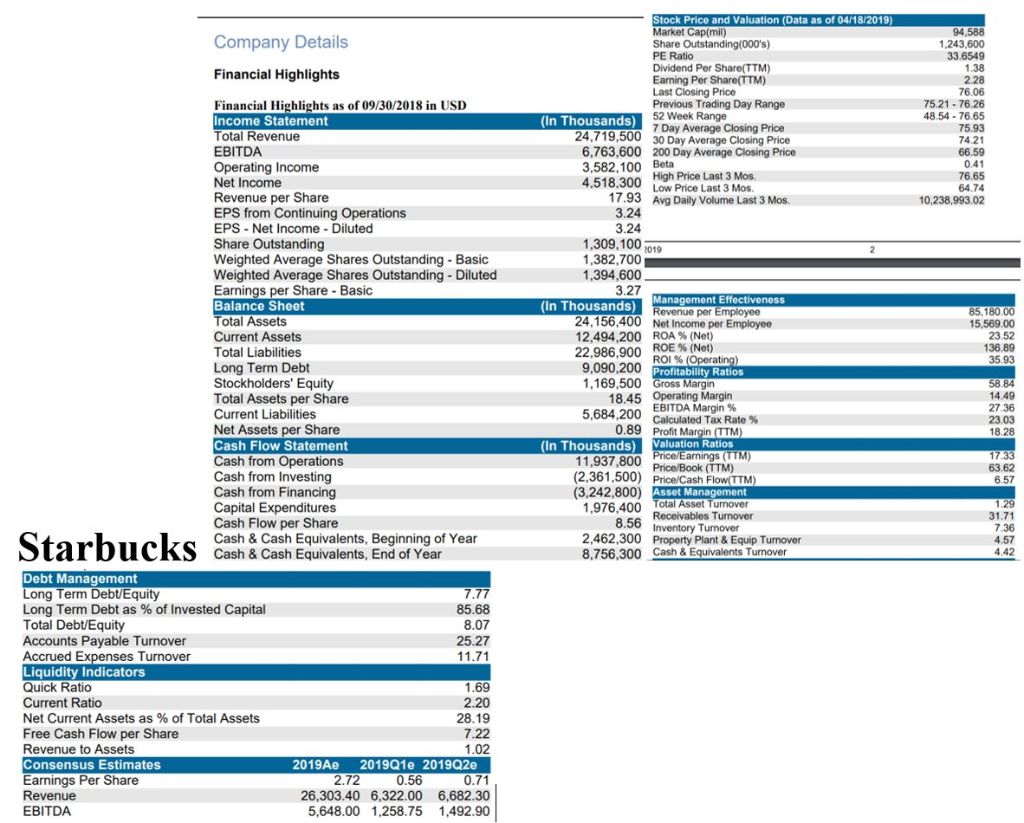
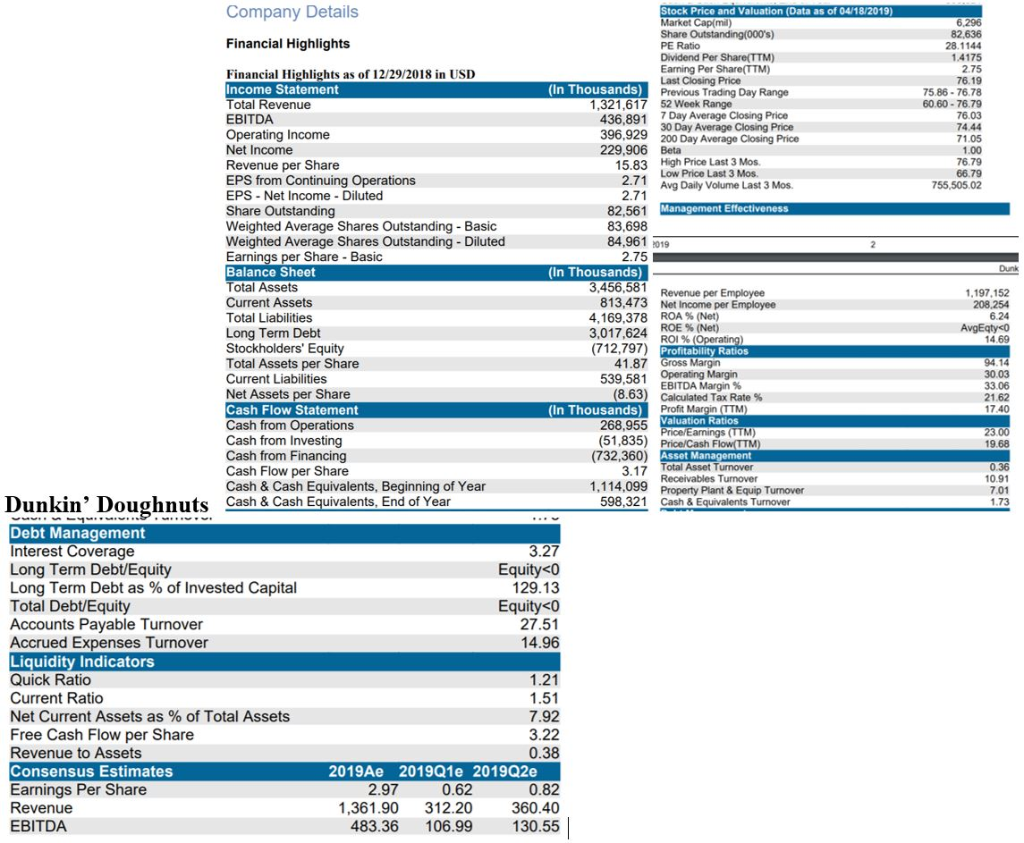
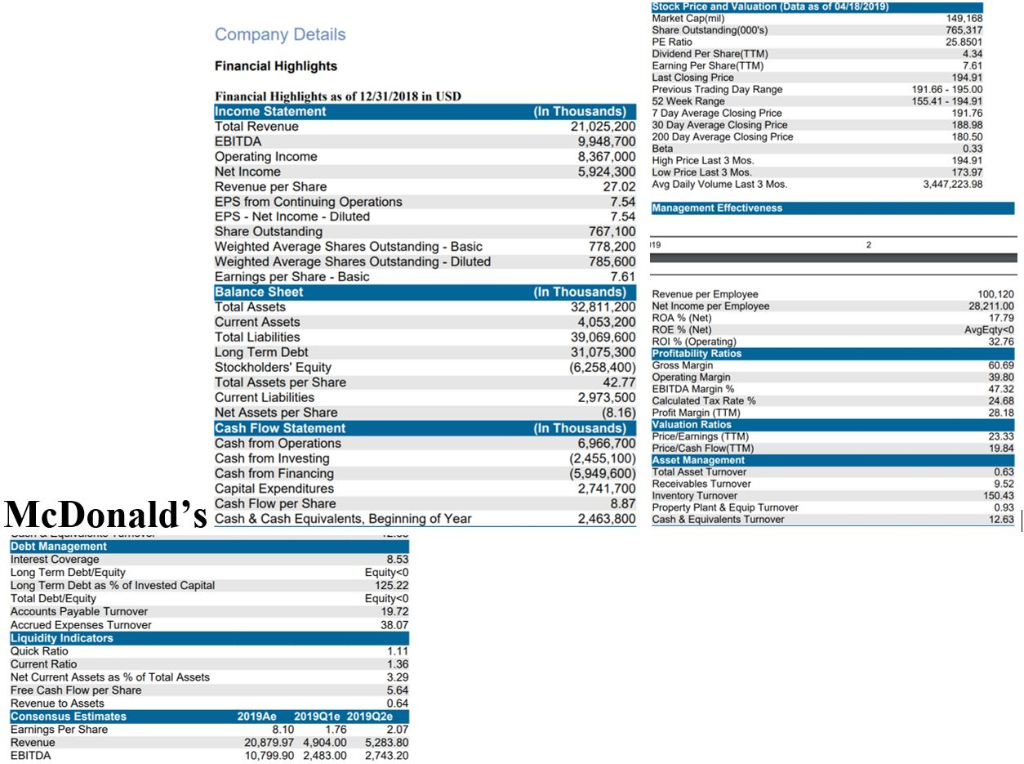
Using the reports above, compare Starbucks with its competitors. Starbucks: Dunkin Doughnuts: McDonald's: Using the reports above, compare Starbucks with its competitors (Dunkin' Donuts and
Using the reports above, compare Starbucks with its competitors.
Starbucks: 
Dunkin Doughnuts: 
McDonald's: 
Using the reports above, compare Starbucks with its competitors (Dunkin' Donuts and McDonald's). Analyze Starbucks' financial performance and please reference specific numbers in the analysis. What can you say about Starbucks' financial performance?
Stock Price and Valuation (Data as of 04/18/2019) Market Cap(mil) 94,588 1,243,600 33.6549 Company Details PE Ratio Financial Highlights Earning Per Share(TTM) Last Closing Price Previous Trading Day Range 52 Week Range 7 Day Average Closing Price 30 Day Average Closing Price 76.06 75.21-76.26 48.54-76.65 75.93 Financial Highlights as of 09/30/2018 in USD Income Statement Total Revenue EBITDA Operating Income Net Income Revenue per Share EPS from Continuing Operations EPS- Net Income Diluted Share Weighted Average Shares Outstanding- Basic Weighted Average Shares Outstanding - Diluted Earnings per Share Basic Balance Sheet Total Assets Current Assets Total Liabilities Long Term Debt Stockholders' Equity Total Assets per Share Current Liabilities Net Assets per Share Cash Flow Statement Cash from Operations Cash from Investing Cash from Financing Capital Expenditures Cash Flow per Share Cash & Cash Equivalents, Beginning of Year Cash & Cash Equivalents, End of Year (In Thousands) 24,719,500 6,763,600 200 Day Average Closing Price 3,582,100 Beta 4,518.300 High Price Last 3 Mos. 66.59 76.65 64.74 10,238,993.02 Low Price Last 3 Mos Avg Daily Volume Last 3 Mos. 3.24 1,309,100 1,382,700 1,394,600 019 t Effectiveness (In Thousands) 24,156,400 12,494,200 22.986.900 9,090,200 1,169,500 18.45 5,684,200 85.180.00 15,569.00 Net Income per Employee ROA % (Net) 136.89 35.93 %(Net) Profitability Ratios Margin 58.84 Operating Margin EBITDA Margin % Calculated Tax Rate % 23.03 0.89 Profit n (TTM (In Thousands) Valuation Ratios 11,937,800 63.62 6.57 Price/Book (TTM) (2,361,500) Price/Cash Flow(TTM) (3,242,800) Asset Ma 1,976.4 otal Asset Turnover Turnover Inventory 2,462,300 Property Plant & Equip Turnover 8,756,300 Cash &E Debt Management Long Term Debt/Equity Long Term Debt as % of Invested Capital Total Debt/Equity Accounts Payable Turnover 85.68 8.07 25.27 urnover Liquidity Indicators Quick Ratio Current Ratio Net Current Assets as % of Total Assets Free Cash Flow per Share Revenue to Assets Consensus Estimates Earnings Per Share Revenue EBITDA 2.20 1.02 2019Ae 2019Q1e 2019Q2e 26,303.40 6,322.00 6,682.30 5,648.00 1,258.75 1,492.90 Company Details Financial Highlights Financial Highlights as of 12/29/2018 in USD tock Price and Valuation (Data as of 04/18/2019) Income Statement (In Thousands) 1,321,617 52 Week Range 436,891 70Day Average Closing Price 3 5.83 High Price Last 3 Mos EPS from Continuing Operations EPS Net Income Diluted Weighted Average Shares Outstanding- Basic Weighted Average Shares Outstanding Diluted Earnings per Share Basic Balance Sheet (In Thousands) 3,456,581 Revenue per Employee 813,473 4,169,378 3,017,624 Net Income per Employee ROA % (Net) ROE %(Net) 1 41.87 Gross Margn (8.63) Calculated Tax Rate % Cash Flow Statement (In Thousands) Total Asset Turnover Property Plant & Equip Turnover Cash & Equivalents Turnover 3.17 1,114,099 598.321 Cash & Cash Equivalents, Beginning of Year Cash & Cash Equivalents, End of Year 6 Dunkin' Doughnuts Debt Management Interest Coverage Long Term Debt/Equity Long Term Debt as % of Invested Capital Total Debt/Equity Accounts Payable Turnover Accrued Expenses Turnover Liquidity Indicators 2 Net Current Assets as % of Total Assets Free Cash Flow per Share Revenue to Assets Consensus Estimates Earnings Per Share 2019Ae 2019Q1e 2019Q2e 2 2 1 4 rice and valuation (Data as o Market Cap(mil) Company Details Financial Highlights Previous Trading Day Range 91.66-195.00 155.41- 194.91 Financial Highlights as of 12/31/2018 in USID Income Statement Total Revenue In Thousands) 7 Day Average Closing Price 30Day Average Closing Price 21,025,200 9,948,700 200 Day Average Closing Price 8,367,000 High Price Last 3 Mos. 5,924,300 Low Price Last 3 Mos. Avg Daily Volume Last 3 Mos. 3,447,223.98 27.02 EPS from Continuing Operations EPS Net Income Diluted Management Effectiveness 778,200 9 Weighted Average Shares Outstanding-Basic Weighted Average Shares Outstanding - Diluted Earnings per Share-Basic Balance Sheet (In Thousands) 32,811,200 Net Income per Employee ROA % (Net) ROE%(Net) 4,053,200 39,069,600 31,075,300 Total Liabilities Profitability Ratios (6,258.400) Gross Margn Stockholders' Equity Total Assets per Share Current Liabilities Net Assets per Share Cash Flow Statement Cash from Operations Cash from Investing Cash from Financing 42.77 2,973,500 EBITDA Margin % Calculated Tax Rate % aluation Ratios (in Thousands arnings (TTM) 6,966,700 Price/Cash Flow (TTM) (2,455,100) (5,949,600) Total Asset Turnover 2.741.700 Inventory Turnov Cash Flow per Share 8.87 9 McDonald's cash & Cash Equiwalents. Beginning of Ye Property Plant&Equip Turnover Cash & E of Year 2,463,800 Debt Management Long Term Debt as % of Invested Capital e Turnover Accrued Expenses Turnover Liquidity Indicators Net Current Assets as % of Total Assets Free Cash Flow per Share Consensus Estimates 2019Ae 2019Q1e 2019Q2e 0 20,879.97 4,904.00 5,283.80 10,799.90 2,483.00 2,743.20 Stock Price and Valuation (Data as of 04/18/2019) Market Cap(mil) 94,588 1,243,600 33.6549 Company Details PE Ratio Financial Highlights Earning Per Share(TTM) Last Closing Price Previous Trading Day Range 52 Week Range 7 Day Average Closing Price 30 Day Average Closing Price 76.06 75.21-76.26 48.54-76.65 75.93 Financial Highlights as of 09/30/2018 in USD Income Statement Total Revenue EBITDA Operating Income Net Income Revenue per Share EPS from Continuing Operations EPS- Net Income Diluted Share Weighted Average Shares Outstanding- Basic Weighted Average Shares Outstanding - Diluted Earnings per Share Basic Balance Sheet Total Assets Current Assets Total Liabilities Long Term Debt Stockholders' Equity Total Assets per Share Current Liabilities Net Assets per Share Cash Flow Statement Cash from Operations Cash from Investing Cash from Financing Capital Expenditures Cash Flow per Share Cash & Cash Equivalents, Beginning of Year Cash & Cash Equivalents, End of Year (In Thousands) 24,719,500 6,763,600 200 Day Average Closing Price 3,582,100 Beta 4,518.300 High Price Last 3 Mos. 66.59 76.65 64.74 10,238,993.02 Low Price Last 3 Mos Avg Daily Volume Last 3 Mos. 3.24 1,309,100 1,382,700 1,394,600 019 t Effectiveness (In Thousands) 24,156,400 12,494,200 22.986.900 9,090,200 1,169,500 18.45 5,684,200 85.180.00 15,569.00 Net Income per Employee ROA % (Net) 136.89 35.93 %(Net) Profitability Ratios Margin 58.84 Operating Margin EBITDA Margin % Calculated Tax Rate % 23.03 0.89 Profit n (TTM (In Thousands) Valuation Ratios 11,937,800 63.62 6.57 Price/Book (TTM) (2,361,500) Price/Cash Flow(TTM) (3,242,800) Asset Ma 1,976.4 otal Asset Turnover Turnover Inventory 2,462,300 Property Plant & Equip Turnover 8,756,300 Cash &E Debt Management Long Term Debt/Equity Long Term Debt as % of Invested Capital Total Debt/Equity Accounts Payable Turnover 85.68 8.07 25.27 urnover Liquidity Indicators Quick Ratio Current Ratio Net Current Assets as % of Total Assets Free Cash Flow per Share Revenue to Assets Consensus Estimates Earnings Per Share Revenue EBITDA 2.20 1.02 2019Ae 2019Q1e 2019Q2e 26,303.40 6,322.00 6,682.30 5,648.00 1,258.75 1,492.90 Company Details Financial Highlights Financial Highlights as of 12/29/2018 in USD tock Price and Valuation (Data as of 04/18/2019) Income Statement (In Thousands) 1,321,617 52 Week Range 436,891 70Day Average Closing Price 3 5.83 High Price Last 3 Mos EPS from Continuing Operations EPS Net Income Diluted Weighted Average Shares Outstanding- Basic Weighted Average Shares Outstanding Diluted Earnings per Share Basic Balance Sheet (In Thousands) 3,456,581 Revenue per Employee 813,473 4,169,378 3,017,624 Net Income per Employee ROA % (Net) ROE %(Net) 1 41.87 Gross Margn (8.63) Calculated Tax Rate % Cash Flow Statement (In Thousands) Total Asset Turnover Property Plant & Equip Turnover Cash & Equivalents Turnover 3.17 1,114,099 598.321 Cash & Cash Equivalents, Beginning of Year Cash & Cash Equivalents, End of Year 6 Dunkin' Doughnuts Debt Management Interest Coverage Long Term Debt/Equity Long Term Debt as % of Invested Capital Total Debt/Equity Accounts Payable Turnover Accrued Expenses Turnover Liquidity Indicators 2 Net Current Assets as % of Total Assets Free Cash Flow per Share Revenue to Assets Consensus Estimates Earnings Per Share 2019Ae 2019Q1e 2019Q2e 2 2 1 4 rice and valuation (Data as o Market Cap(mil) Company Details Financial Highlights Previous Trading Day Range 91.66-195.00 155.41- 194.91 Financial Highlights as of 12/31/2018 in USID Income Statement Total Revenue In Thousands) 7 Day Average Closing Price 30Day Average Closing Price 21,025,200 9,948,700 200 Day Average Closing Price 8,367,000 High Price Last 3 Mos. 5,924,300 Low Price Last 3 Mos. Avg Daily Volume Last 3 Mos. 3,447,223.98 27.02 EPS from Continuing Operations EPS Net Income Diluted Management Effectiveness 778,200 9 Weighted Average Shares Outstanding-Basic Weighted Average Shares Outstanding - Diluted Earnings per Share-Basic Balance Sheet (In Thousands) 32,811,200 Net Income per Employee ROA % (Net) ROE%(Net) 4,053,200 39,069,600 31,075,300 Total Liabilities Profitability Ratios (6,258.400) Gross Margn Stockholders' Equity Total Assets per Share Current Liabilities Net Assets per Share Cash Flow Statement Cash from Operations Cash from Investing Cash from Financing 42.77 2,973,500 EBITDA Margin % Calculated Tax Rate % aluation Ratios (in Thousands arnings (TTM) 6,966,700 Price/Cash Flow (TTM) (2,455,100) (5,949,600) Total Asset Turnover 2.741.700 Inventory Turnov Cash Flow per Share 8.87 9 McDonald's cash & Cash Equiwalents. Beginning of Ye Property Plant&Equip Turnover Cash & E of Year 2,463,800 Debt Management Long Term Debt as % of Invested Capital e Turnover Accrued Expenses Turnover Liquidity Indicators Net Current Assets as % of Total Assets Free Cash Flow per Share Consensus Estimates 2019Ae 2019Q1e 2019Q2e 0 20,879.97 4,904.00 5,283.80 10,799.90 2,483.00 2,743.20Step by Step Solution
There are 3 Steps involved in it
Step: 1

Get Instant Access to Expert-Tailored Solutions
See step-by-step solutions with expert insights and AI powered tools for academic success
Step: 2

Step: 3

Ace Your Homework with AI
Get the answers you need in no time with our AI-driven, step-by-step assistance
Get Started


