

Answered step by step
Verified Expert Solution
Question
1 Approved Answer
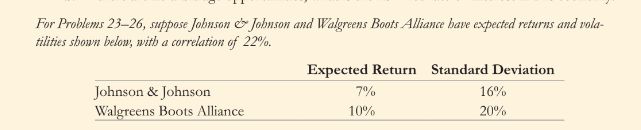
Using the same data as for Problem 2 3 , calculate the expected return and the volatility ( standard deviation ) of a portfolio consisting
Using the same data as for Problem calculate the expected return and the volatility standard deviation of a portfolio consisting of Johnson & Johnsons and Walgreens stocks using a wide range of portfolio weights. Plot the expected return as a function of the portfolio volatility.
Using your graph, identify the range of Johnson & Johnsons portfolio weights that yield eficient combinations of the two stocks, rounded to the nearest percentage point.For Problems suppose Jobnson & Johnson and Walgreens Boots. Alliance have expected returns and volatilities shown below, with a correlation of
Step by Step Solution
There are 3 Steps involved in it
Step: 1

Get Instant Access to Expert-Tailored Solutions
See step-by-step solutions with expert insights and AI powered tools for academic success
Step: 2

Step: 3
Ace Your Homework with AI
Get the answers you need in no time with our AI-driven, step-by-step assistance
Get Started
ISE Real Estate Finance And Investments
Authors: Jeffrey Fisher William B. Brueggeman
17th International Edition
1264892888, 9781264892884