Answered step by step
Verified Expert Solution
Question
1 Approved Answer
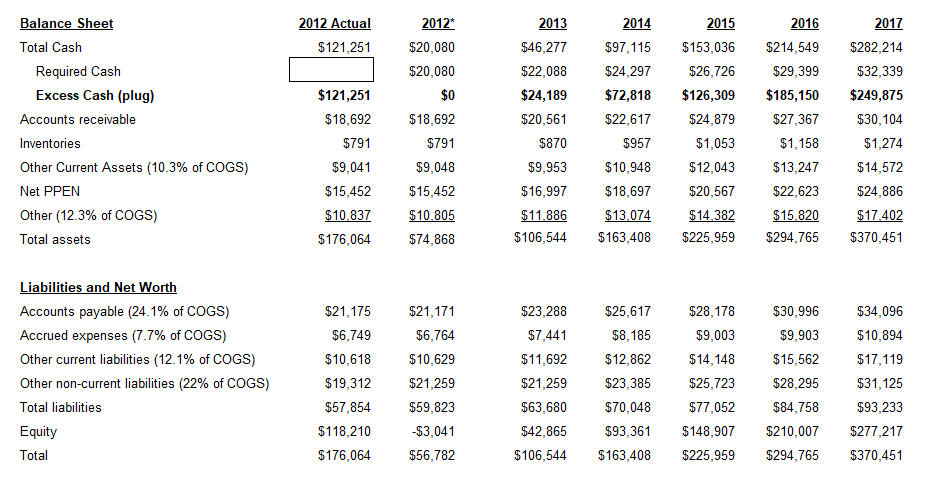
Using the same model assumptions, how much excess cash will Apple have in 2013 for strategic or dividend purposes? A. $44.2 B. $37.0 C. None
Using the same model assumptions, how much excess cash will Apple have in 2013 for strategic or dividend purposes?
A. $44.2
B. $37.0
C. None of these
D. $84.9


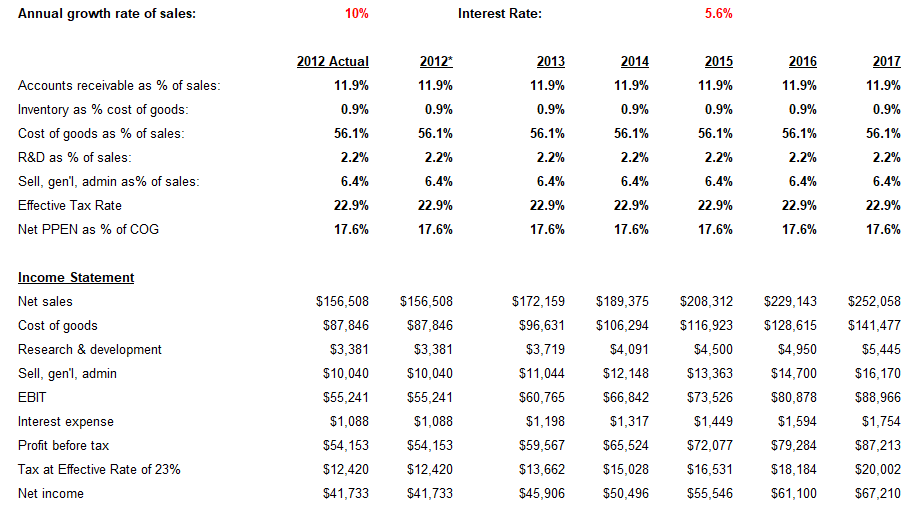
Here are my assumptions, and the IS in case that's needed. Overseas cash is 69% of their total cash in 2012. With a tax consequence of 35% for the overseas cash. The answer is NOT C.
2012 Actual $121,251 2012* $20,080 $20,080 2014 $97,115 $24,297 $72,818 $22,617 $0 Balance Sheet Total Cash Required Cash Excess Cash (plug) Accounts receivable Inventories Other Current Assets (10.3% of COGS) Net PPEN Other (12.3% of COGS) Total assets $121,251 $18,692 $791 $9,041 $15,452 $10.837 $176,064 2013 $46,277 $22,088 $24,189 $20,561 $870 $9,953 $16,997 $11.886 $106,544 $18,692 $791 $9,048 $15,452 $10.805 $74,868 2015 $153,036 $26,726 $126,309 $24,879 $1,053 $12,043 $20,567 $14.382 $225,959 2016 $214,549 $29,399 $185,150 $27,367 $1,158 $13,247 $22,623 $15,820 $294,765 $957 2017 $282,214 $32,339 $249,875 $30,104 $1,274 $14,572 $24,886 $17.402 $370,451 $10,948 $18,697 $13.074 $163,408 Liabilities and Net Worth Accounts payable (24.1% of COGS) Accrued expenses (7.7% of COGS) Other current liabilities (12.1% of COGS) Other non-current liabilities (22% of COGS) Total liabilities $21,175 $6,749 $10,618 $19,312 $57,854 $118,210 $176,064 $21,171 $6,764 $10,629 $21,259 $59,823 $3,041 $56,782 $23,288 $7,441 $11,692 $21,259 $63,680 $42,865 $106,544 $25,617 $8,185 $12,862 $23,385 $70,048 $93,361 $163,408 $28,178 $9,003 $14,148 $25,723 $77,052 $148,907 $225,959 $30,996 $9,903 $15,562 $28,295 $84,758 $210,007 $294,765 $34,096 $10,894 $17,119 $31,125 $93,233 $277,217 $370,451 Equity Total Annual growth rate of sales: 10% Interest Rate: 5.6% Accounts receivable as % of sales: Inventory as % cost of goods: Cost of goods as % of sales: R&D as % of sales Sell, gen'l, admin as% of sales: Effective Tax Rate Net PPEN as % of COG 2012 Actual 11.9% 0.9% 56.1% 2.2% 6.4% 22.9% 17.6% 2012* 11.9% 0.9% 56.1% 2.2% 6.4% 22.9% 17.6% 2013 11.9% 0.9% 56.1% 2.2% 6.4% 22.9% 17.6% 2014 11.9% 0.9% 56.1% 2.2% 6.4% 22.9% 17.6% 2015 11.9% 0.9% 56.1% 2.2% 6.4% 22.9% 17.6% 2016 11.9% 0.9% 56.1% 2.2% 6.4% 22.9% 17.6% 2017 11.9% 0.9% 56.1% 2.2% 6.4% 22.9% 17.6% Income Statement Net sales Cost of goods Research & development Sell, gen'l, admin EBIT Interest expense Profit before tax Tax at Effective Rate of 23% Net income $156,508 $87,846 $3,381 $10,040 $55,241 $1,088 $54,153 $12,420 $41,733 $156,508 $87,846 $3,381 $10,040 $55,241 $1,088 $54,153 $12,420 $41,733 $172,159 $96,631 $3,719 $11,044 $60,765 $1,198 $59,567 $13,662 $45,906 $189,375 $106,294 $4,091 $12,148 $66,842 $1,317 $65,524 $15,028 $50,496 $208,312 $116,923 $4,500 $13,363 $73,526 $1,449 $72,077 $16,531 $55,546 $229,143 $128,615 $4,950 $14,700 $80,878 $1,594 $79,284 $18,184 $61,100 $252,058 $141,477 $5,445 $16,170 $88,966 $1,754 $87,213 $20,002 $67,210 2012 Actual $121,251 2012* $20,080 $20,080 2014 $97,115 $24,297 $72,818 $22,617 $0 Balance Sheet Total Cash Required Cash Excess Cash (plug) Accounts receivable Inventories Other Current Assets (10.3% of COGS) Net PPEN Other (12.3% of COGS) Total assets $121,251 $18,692 $791 $9,041 $15,452 $10.837 $176,064 2013 $46,277 $22,088 $24,189 $20,561 $870 $9,953 $16,997 $11.886 $106,544 $18,692 $791 $9,048 $15,452 $10.805 $74,868 2015 $153,036 $26,726 $126,309 $24,879 $1,053 $12,043 $20,567 $14.382 $225,959 2016 $214,549 $29,399 $185,150 $27,367 $1,158 $13,247 $22,623 $15,820 $294,765 $957 2017 $282,214 $32,339 $249,875 $30,104 $1,274 $14,572 $24,886 $17.402 $370,451 $10,948 $18,697 $13.074 $163,408 Liabilities and Net Worth Accounts payable (24.1% of COGS) Accrued expenses (7.7% of COGS) Other current liabilities (12.1% of COGS) Other non-current liabilities (22% of COGS) Total liabilities $21,175 $6,749 $10,618 $19,312 $57,854 $118,210 $176,064 $21,171 $6,764 $10,629 $21,259 $59,823 $3,041 $56,782 $23,288 $7,441 $11,692 $21,259 $63,680 $42,865 $106,544 $25,617 $8,185 $12,862 $23,385 $70,048 $93,361 $163,408 $28,178 $9,003 $14,148 $25,723 $77,052 $148,907 $225,959 $30,996 $9,903 $15,562 $28,295 $84,758 $210,007 $294,765 $34,096 $10,894 $17,119 $31,125 $93,233 $277,217 $370,451 Equity Total Annual growth rate of sales: 10% Interest Rate: 5.6% Accounts receivable as % of sales: Inventory as % cost of goods: Cost of goods as % of sales: R&D as % of sales Sell, gen'l, admin as% of sales: Effective Tax Rate Net PPEN as % of COG 2012 Actual 11.9% 0.9% 56.1% 2.2% 6.4% 22.9% 17.6% 2012* 11.9% 0.9% 56.1% 2.2% 6.4% 22.9% 17.6% 2013 11.9% 0.9% 56.1% 2.2% 6.4% 22.9% 17.6% 2014 11.9% 0.9% 56.1% 2.2% 6.4% 22.9% 17.6% 2015 11.9% 0.9% 56.1% 2.2% 6.4% 22.9% 17.6% 2016 11.9% 0.9% 56.1% 2.2% 6.4% 22.9% 17.6% 2017 11.9% 0.9% 56.1% 2.2% 6.4% 22.9% 17.6% Income Statement Net sales Cost of goods Research & development Sell, gen'l, admin EBIT Interest expense Profit before tax Tax at Effective Rate of 23% Net income $156,508 $87,846 $3,381 $10,040 $55,241 $1,088 $54,153 $12,420 $41,733 $156,508 $87,846 $3,381 $10,040 $55,241 $1,088 $54,153 $12,420 $41,733 $172,159 $96,631 $3,719 $11,044 $60,765 $1,198 $59,567 $13,662 $45,906 $189,375 $106,294 $4,091 $12,148 $66,842 $1,317 $65,524 $15,028 $50,496 $208,312 $116,923 $4,500 $13,363 $73,526 $1,449 $72,077 $16,531 $55,546 $229,143 $128,615 $4,950 $14,700 $80,878 $1,594 $79,284 $18,184 $61,100 $252,058 $141,477 $5,445 $16,170 $88,966 $1,754 $87,213 $20,002 $67,210Step by Step Solution
There are 3 Steps involved in it
Step: 1

Get Instant Access to Expert-Tailored Solutions
See step-by-step solutions with expert insights and AI powered tools for academic success
Step: 2

Step: 3

Ace Your Homework with AI
Get the answers you need in no time with our AI-driven, step-by-step assistance
Get Started


