Using the Selected Additional Data from the Mini Case, perform an abbreviated financial analysis and comment on Hatfields strengths and weaknesses relative to the industry within the areas of Liquidity, Asset Management, Debt Management, Profitability, and Market Value.
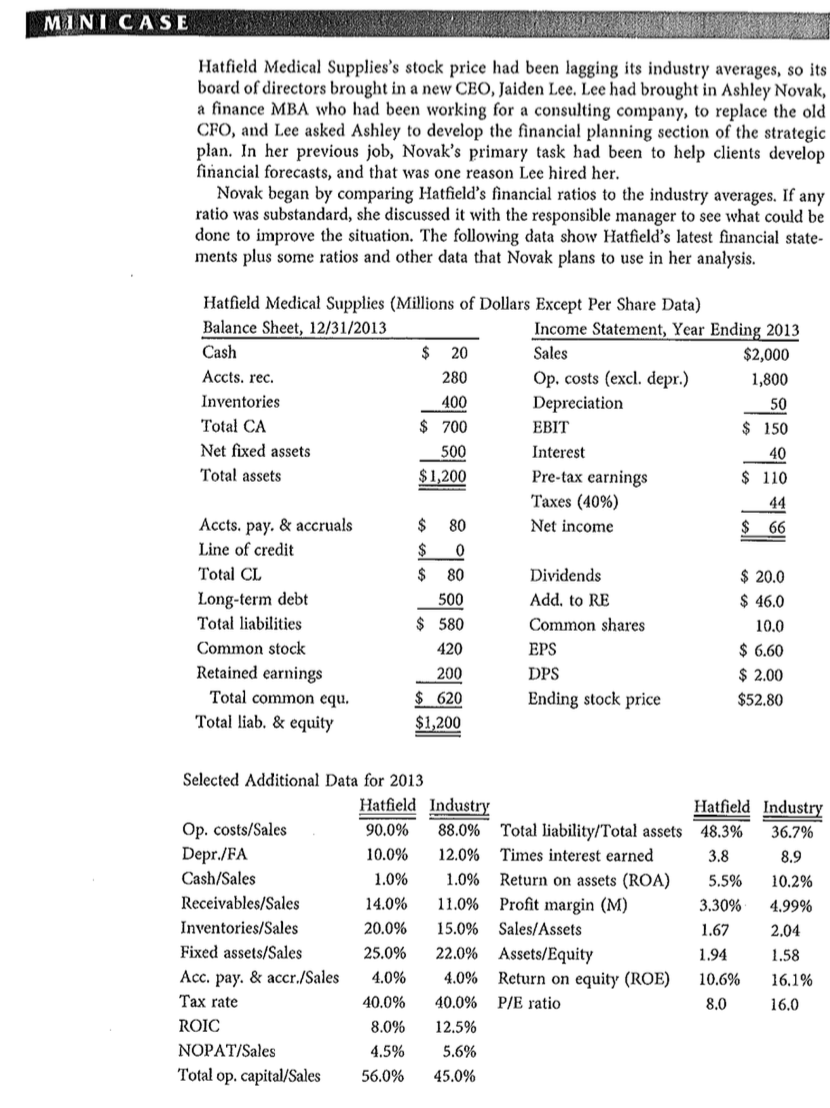
MINI CASE Hatfield Medical Supplies's stock price had been lagging its industry averages, so its board of directors brought in a new CEO, Jaiden Lee. Lee had brought in Ashley Novak, a finance MBA who had been working for a consulting company, to replace the old CFO, and Lee asked Ashley to develop the financial planning section of the strategic plan. In her previous job, Novak's primary task had been to help clients develop financial forecasts, and that was one reason Lee hired her. Novak began by comparing Hatfield's financial ratios to the industry averages. If any ratio was substandard, she discussed it with the responsible manager to see what could be done to improve the situation. The following data show Hatfield's latest financial state- ments plus some ratios and other data that Novak plans to use in her analysis. Hatfield Medical Supplies (Millions of Dollars Except Per Share Data) Balance Sheet, 12/31/2013 Income Statement, Year Ending 2013 Cash $ 20 Sales $2,000 Accts. rec. 280 Op. costs (excl. depr.) 1,800 Inventories 400 Depreciation 50 Total CA $ 700 EBIT $ 150 Net fixed assets 500 Interest 40 Total assets $1,200 Pre-tax earnings $ 110 Taxes (40%) 44 Accts. pay. & accruals $ 80 Net income $ 66 Line of credit $ 0 Total CL $ 80 Dividends $ 20.0 Long-term debt 500 Add. to RE $ 46.0 Total liabilities $ 580 Common shares 10.0 Common stock 420 EPS $ 6.60 Retained earnings 200 DPS $ 2.00 Total common equ. $ 620 Ending stock price $52.80 Total liab. & equity $1,200 19911991 Selected Additional Data for 2013 Hatfield Industry Hatfield Industry Op. costs/Sales 90.0% 88.0% Total liability/Total assets 48.3% 36.796 Depr./FA 10.0% 12.0% Times interest earned 3.8 8.9 Cash/Sales 1.0% 1.096 Return on assets (ROA) 5.5% 10.2% Receivables/Sales 14.0% 11.0% Profit margin (M) 3.30% 4.99% Inventories/Sales 20.0% 15.0% Sales/Assets 1.67 2.04 Fixed assets/Sales 25.0% 22.0% Assets/Equity 1.94 1.58 Acc. pay. & accr./Sales 4.0% 4.0% Return on equity (ROE) 10.6% 16.1% 40.0% 40.0% P/E ratio 8.0 16,0 ROIC 8.0% 12.596 NOPAT/Sales 4.5% 5.6% Total op. capital/Sales 56.0% 45.0% Tax rate MINI CASE Hatfield Medical Supplies's stock price had been lagging its industry averages, so its board of directors brought in a new CEO, Jaiden Lee. Lee had brought in Ashley Novak, a finance MBA who had been working for a consulting company, to replace the old CFO, and Lee asked Ashley to develop the financial planning section of the strategic plan. In her previous job, Novak's primary task had been to help clients develop financial forecasts, and that was one reason Lee hired her. Novak began by comparing Hatfield's financial ratios to the industry averages. If any ratio was substandard, she discussed it with the responsible manager to see what could be done to improve the situation. The following data show Hatfield's latest financial state- ments plus some ratios and other data that Novak plans to use in her analysis. Hatfield Medical Supplies (Millions of Dollars Except Per Share Data) Balance Sheet, 12/31/2013 Income Statement, Year Ending 2013 Cash $ 20 Sales $2,000 Accts. rec. 280 Op. costs (excl. depr.) 1,800 Inventories 400 Depreciation 50 Total CA $ 700 EBIT $ 150 Net fixed assets 500 Interest 40 Total assets $1,200 Pre-tax earnings $ 110 Taxes (40%) 44 Accts. pay. & accruals $ 80 Net income $ 66 Line of credit $ 0 Total CL $ 80 Dividends $ 20.0 Long-term debt 500 Add. to RE $ 46.0 Total liabilities $ 580 Common shares 10.0 Common stock 420 EPS $ 6.60 Retained earnings 200 DPS $ 2.00 Total common equ. $ 620 Ending stock price $52.80 Total liab. & equity $1,200 19911991 Selected Additional Data for 2013 Hatfield Industry Hatfield Industry Op. costs/Sales 90.0% 88.0% Total liability/Total assets 48.3% 36.796 Depr./FA 10.0% 12.0% Times interest earned 3.8 8.9 Cash/Sales 1.0% 1.096 Return on assets (ROA) 5.5% 10.2% Receivables/Sales 14.0% 11.0% Profit margin (M) 3.30% 4.99% Inventories/Sales 20.0% 15.0% Sales/Assets 1.67 2.04 Fixed assets/Sales 25.0% 22.0% Assets/Equity 1.94 1.58 Acc. pay. & accr./Sales 4.0% 4.0% Return on equity (ROE) 10.6% 16.1% 40.0% 40.0% P/E ratio 8.0 16,0 ROIC 8.0% 12.596 NOPAT/Sales 4.5% 5.6% Total op. capital/Sales 56.0% 45.0% Tax rate