

Question
Using the table attached below, plot the opportunity set of risky assets in Excel. Then vary the correlation between stocks and bonds from + 1
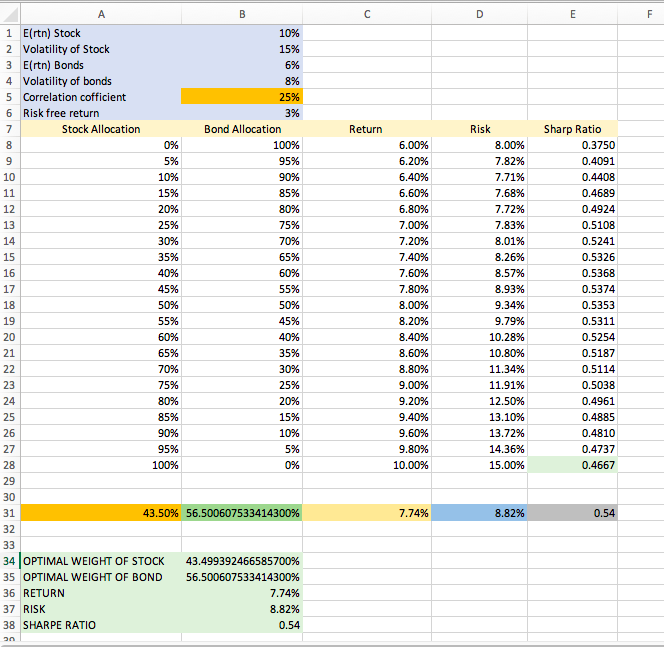
Using the table attached below, plot the opportunity set of risky assets in Excel. Then vary the correlation between stocks and bonds from + 1 to -1 and describe the changes in shape of the efficient frontier as you do so. Upload the Excel file that contains the table & graph. Also include in Excel file a description of the efficient frontier's shape as you vary the correlation.
Step by Step Solution
There are 3 Steps involved in it
Step: 1

Get Instant Access to Expert-Tailored Solutions
See step-by-step solutions with expert insights and AI powered tools for academic success
Step: 2

Step: 3
Ace Your Homework with AI
Get the answers you need in no time with our AI-driven, step-by-step assistance
Get Started
The Concepts And Practice Of Mathematical Finance
Authors: Mark S. Joshi
2nd Edition
0521514088, 9780521514088