Using the Tesla Financial Analysis (FY 2013 FY 2010) and Key Ratio Comparison, calculate the missing values. (Enter your answers in thousands of dollars. Round your answers to 2 decimal place. Omit the "$" & "%" signs in your response.)
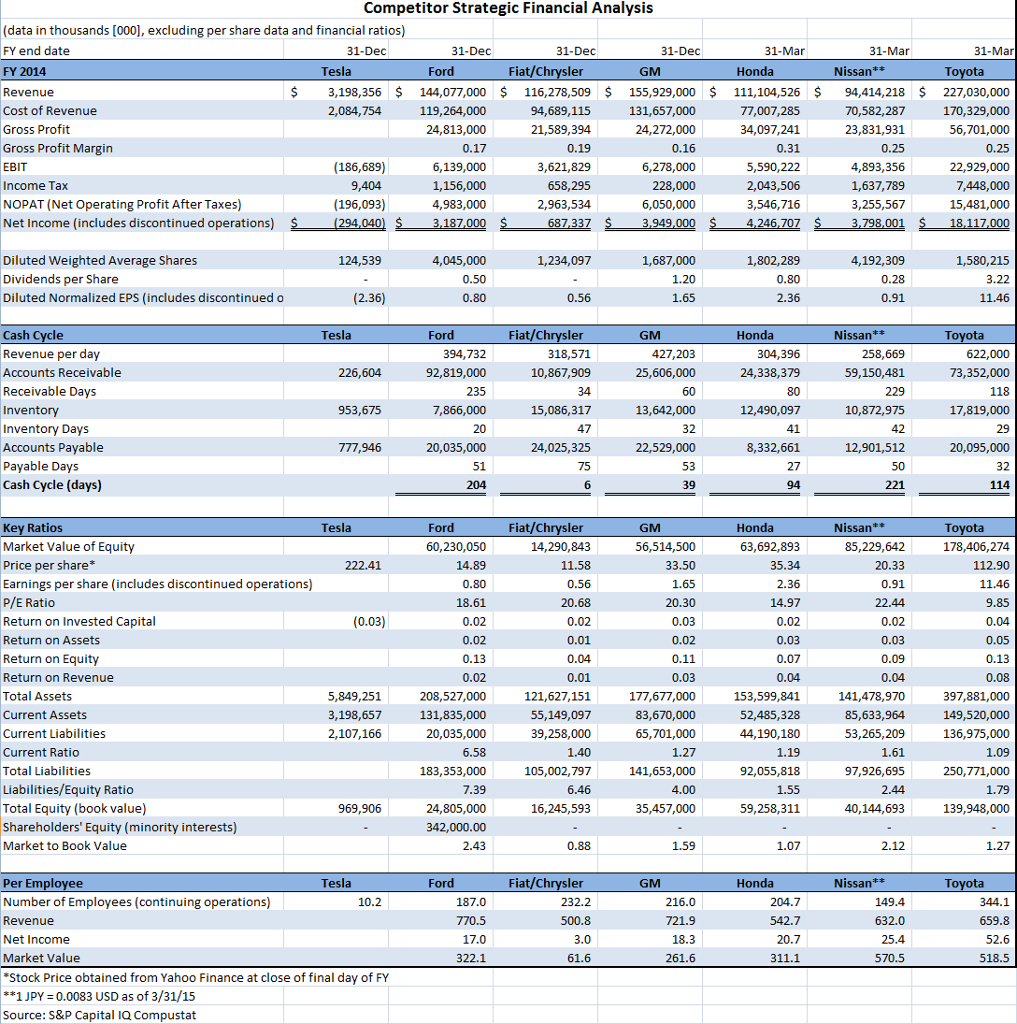
| Tesla Strategic Financial Analysis |
| (data in thousands [000s], excluding per share data and financial ratios) | | |
| FY end date | | 31- Dec |
| | | FY 2014 |
| Revenue | $ | 3,198,356 |
| Cost of Revenue | | 2,084,754 |
| Gross Profit | | |
| Gross Profit Margin | | |
| EBIT | | (186,689) |
| Income Tax | | 9,404 |
| NOPAT (Net Operating Profit After Taxes) | | (196,093) |
| Net Income (includes discontinued operations) | $ | (294,040) |
| | | |
| Diluted Weighted Average Shares | | 124,539 |
| Dividends per Share | | - |
| Diluted Normalized EPS (includes discontinued operations) | | (2.36) |
| | | |
| Cash Cycle | | FY 2014 |
| Revenue per day | | |
| Accounts Receivable | | 226,604 |
| Receivable Days | | |
| Inventory | | 953,675 |
| Inventory Days | | |
| Accounts Payable | | 777,946 |
| Payable Days | | |
| Cash Cycle (days) | | () |
| | | |
| Key Ratios | | FY 2014 |
| Market Value of Book Equity | | |
| Price per share* | | 222.41 |
| Earnings per share (includes discontinued operations) | | () |
| P/E Ratio | | () |
| Return on Invested Capital | | (0.03) |
| Return on Assets | | () |
| Return on Equity | | () |
| Return on Revenue | | () |
| Total Assets | | 5,849,251 |
| Current Assets | | 3,198,657 |
| Current Liabilities | | 2,107,166 |
| Current Ratio | | |
| Total Liabilities | | |
| Liabilities/Equity Ratio | | |
| Total Equity (book value) | | 969,906 |
| Shareholders' Equity (minority interests) | | - |
| Market to Book Value | | |
| | | |
| Per Employee | | FY 2014 |
| Number of Employees (continuing operations) | | 10.2 |
| Revenue | | |
| Net Income | | () |
| Market Value | | |
| |
*Stock price obtained from Yahoo Finance at close of final day of FY
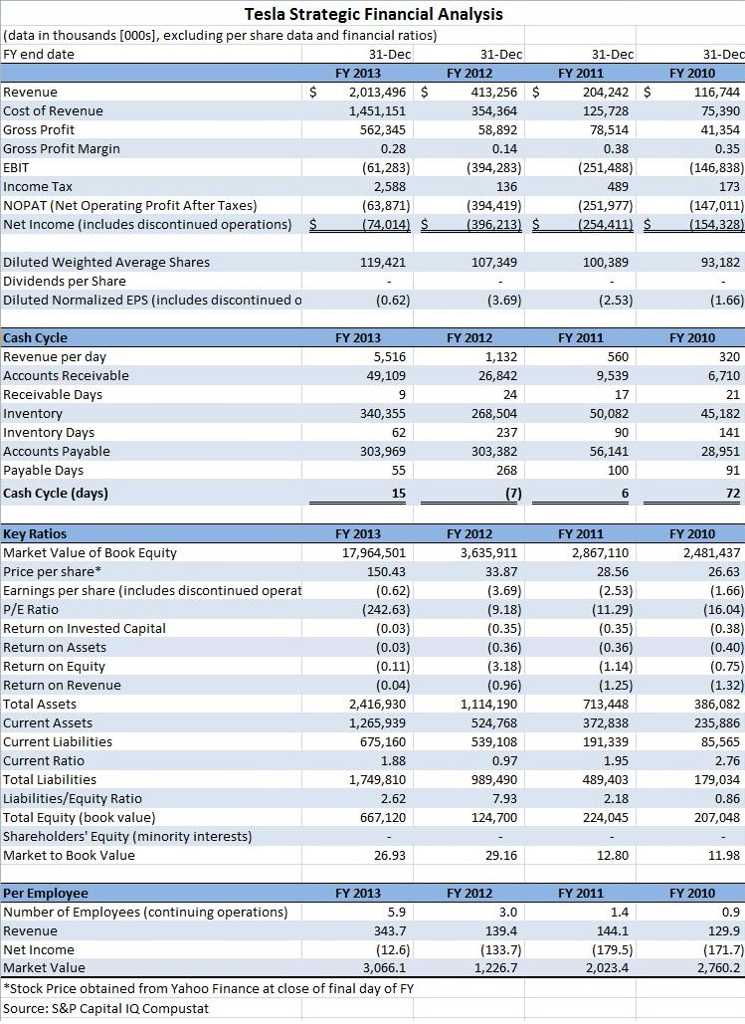
Tesla Strategic Financial Analysis (data in thousands [000s], excluding per share data and financial ratios) FY end date 31-Dec FY 2013 FY 2012 FY 2011 FY 2010 204,242 $ 125,728 $2,013,496 $ 413,256 $ 116,744 Revenue Cost of Revenue Gross Profit Gross Profit Margin 1,451,151 562,345 (61,283) (63,871) 0.35 (394,283) 136 (394,419) 1396 213 (146,838) 489 Income Tax NOPAT (Net Operating Profit After Taxes) Net Income (includes discontinued operations) (147,011) 1154328) S (74014 s s -1254,4111 s 107,349 100,389 Diluted Weighted Average Shares Dividends per Share Diluted Normalized EPS (includes discontinued o 93,182 Cash Cycle Revenue per day Accounts Receivable Receivable Days Inventory Inventory Days Accounts Payable FY 2013 FY 2012 FY 2011 FY 2010 1,132 560 21 340,355 62 45,182 90 303,382 56,141 28,951 Cash Cycle (days) 15 7) 72 FY 2013 FY 2012 FY 2011 FY 2010 Market Value of Book Equity Price per share* Earnings per share (includes discontinued operat 17,964,501 3,635,911 33.87 2,867,110 2,481,437 (242.63) Return on Invested Capital Return on Assets Return on Equity Return on Revenue Total Assets Current Assets Current Liabilities Current Ratio Total Liabilities Liabilities/Equity Ratio Total Equity (book value) Shareholders' Equity (minority interests) Market to Book Value 2,416,930 1,265,939 675,160 1,114,190 524,768 539,108 713,448 372,838 191,339 386,082 235,886 1,749,810 989,490 489,403 179,034 FY 2013 FY 2011 FY 2010 Number of Employees (continuing operations) Revenue Net Income Market Value *Stock Price obtained from Yahoo Finance at close of final day of FY Source: S&P Capital IQ Compustat 1.4 139.4 12.6 1,226.7 2,760.2 Tesla Strategic Financial Analysis (data in thousands [000s], excluding per share data and financial ratios) FY end date 31-Dec FY 2013 FY 2012 FY 2011 FY 2010 204,242 $ 125,728 $2,013,496 $ 413,256 $ 116,744 Revenue Cost of Revenue Gross Profit Gross Profit Margin 1,451,151 562,345 (61,283) (63,871) 0.35 (394,283) 136 (394,419) 1396 213 (146,838) 489 Income Tax NOPAT (Net Operating Profit After Taxes) Net Income (includes discontinued operations) (147,011) 1154328) S (74014 s s -1254,4111 s 107,349 100,389 Diluted Weighted Average Shares Dividends per Share Diluted Normalized EPS (includes discontinued o 93,182 Cash Cycle Revenue per day Accounts Receivable Receivable Days Inventory Inventory Days Accounts Payable FY 2013 FY 2012 FY 2011 FY 2010 1,132 560 21 340,355 62 45,182 90 303,382 56,141 28,951 Cash Cycle (days) 15 7) 72 FY 2013 FY 2012 FY 2011 FY 2010 Market Value of Book Equity Price per share* Earnings per share (includes discontinued operat 17,964,501 3,635,911 33.87 2,867,110 2,481,437 (242.63) Return on Invested Capital Return on Assets Return on Equity Return on Revenue Total Assets Current Assets Current Liabilities Current Ratio Total Liabilities Liabilities/Equity Ratio Total Equity (book value) Shareholders' Equity (minority interests) Market to Book Value 2,416,930 1,265,939 675,160 1,114,190 524,768 539,108 713,448 372,838 191,339 386,082 235,886 1,749,810 989,490 489,403 179,034 FY 2013 FY 2011 FY 2010 Number of Employees (continuing operations) Revenue Net Income Market Value *Stock Price obtained from Yahoo Finance at close of final day of FY Source: S&P Capital IQ Compustat 1.4 139.4 12.6 1,226.7 2,760.2