

Question
. Using the Under Armours financial statements and stock price provided for the 2019 Fiscal Year, calculate the ten financial ratios (Year of 2019) *For
. Using the Under Armours financial statements and stock price provided for the 2019 Fiscal Year, calculate the ten financial ratios (Year of 2019) 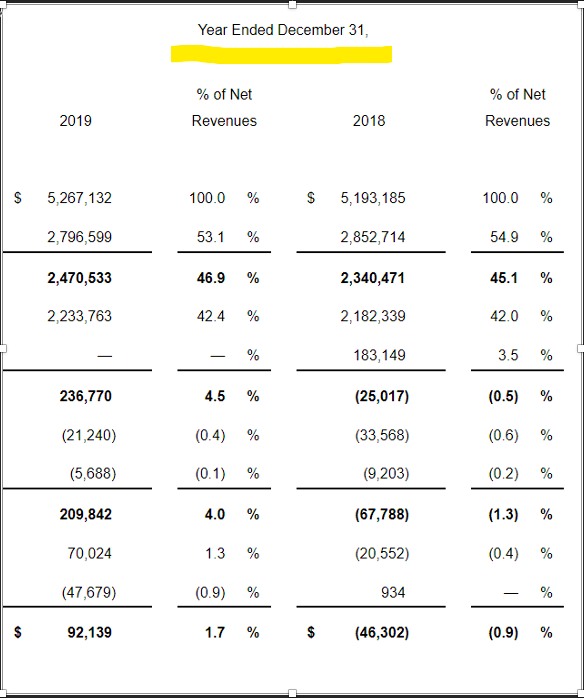
*For the whole fiscal year, refer to Year Ended December 31 section (see example below).
(1) Current ratio = Current assets =
Current liabilities
(2) Quick ratio =
(3) Total asset turnover ratio = Net sales*
Average total assets
* Note that Under Armours income statement uses Net Revenues, instead, on its income statement.
(4) Inventory turnover ratio =
(5) Debt ratio =
(6) Interest coverage ratio = Earnings Before Interest and Taxes (EBIT)*
Interest expense
* On UAs income statement, EBIT is not directly provided. It must be self-calculated by using the Gross Margin figure and subtracting the subsequent expenses not related to interest or taxes, which here represent the two lines/values immediately below Gross Margin.
(7) Net profit margin =
(8) Return on equity =
(9) Market value =
* Per Yahoo Finance, the price per share finished at $19.18 by the end of 2019. The number of shares of common stocks was222,739,680.
(10) Price-to-earnings ratio =
*Earnings per share = Net Income/Numbers of outstanding shares of common stock
2. Compare the financial statements between Nike (in book chapter) and Under Armour and respond to the following questions.
(1) In what ratio areas is Nike stronger than Under Armour?
(2) In what ratio areas is Under Armour stronger than Nike?
(3) If you were an investor considering purchasing stock in either Nike or Under Armour, in which company would you purchase stock? Explain and support your answer.
Year Ended December 31, % of Net Revenues % of Net Revenues 2019 2018 S 5,267,132 100.0 % $ 5,193,185 100.0 % 2,796,599 53.1 % 2,852,714 54.9 % 2,470,533 46.9 % 2,340,471 45.1 % 2,233,763 42.4 % 2,182,339 42.0 % % 183,149 3.5 % 236,770 4.5 % (25,017) (0.5) % (21,240) (0.4) % (33,568) (0.6) % (5,688) (0.1) % (9,203) (0.2) % 209,842 4.0 % (67,788) (1.3) % 70,024 1.3 % (20,552) (0.4) % (47,679) (0.9) % 934 % 92,139 1.7 % $ (46,302) (0.9) % Year Ended December 31, % of Net Revenues % of Net Revenues 2019 2018 S 5,267,132 100.0 % $ 5,193,185 100.0 % 2,796,599 53.1 % 2,852,714 54.9 % 2,470,533 46.9 % 2,340,471 45.1 % 2,233,763 42.4 % 2,182,339 42.0 % % 183,149 3.5 % 236,770 4.5 % (25,017) (0.5) % (21,240) (0.4) % (33,568) (0.6) % (5,688) (0.1) % (9,203) (0.2) % 209,842 4.0 % (67,788) (1.3) % 70,024 1.3 % (20,552) (0.4) % (47,679) (0.9) % 934 % 92,139 1.7 % $ (46,302) (0.9) %Step by Step Solution
There are 3 Steps involved in it
Step: 1

Get Instant Access to Expert-Tailored Solutions
See step-by-step solutions with expert insights and AI powered tools for academic success
Step: 2

Step: 3
Ace Your Homework with AI
Get the answers you need in no time with our AI-driven, step-by-step assistance
Get Started
L Earn Bitcoin Become Financially Sovereign
Authors: Anita Posch ,Mark Kersley
1st Edition
3950504370, 978-3950504378