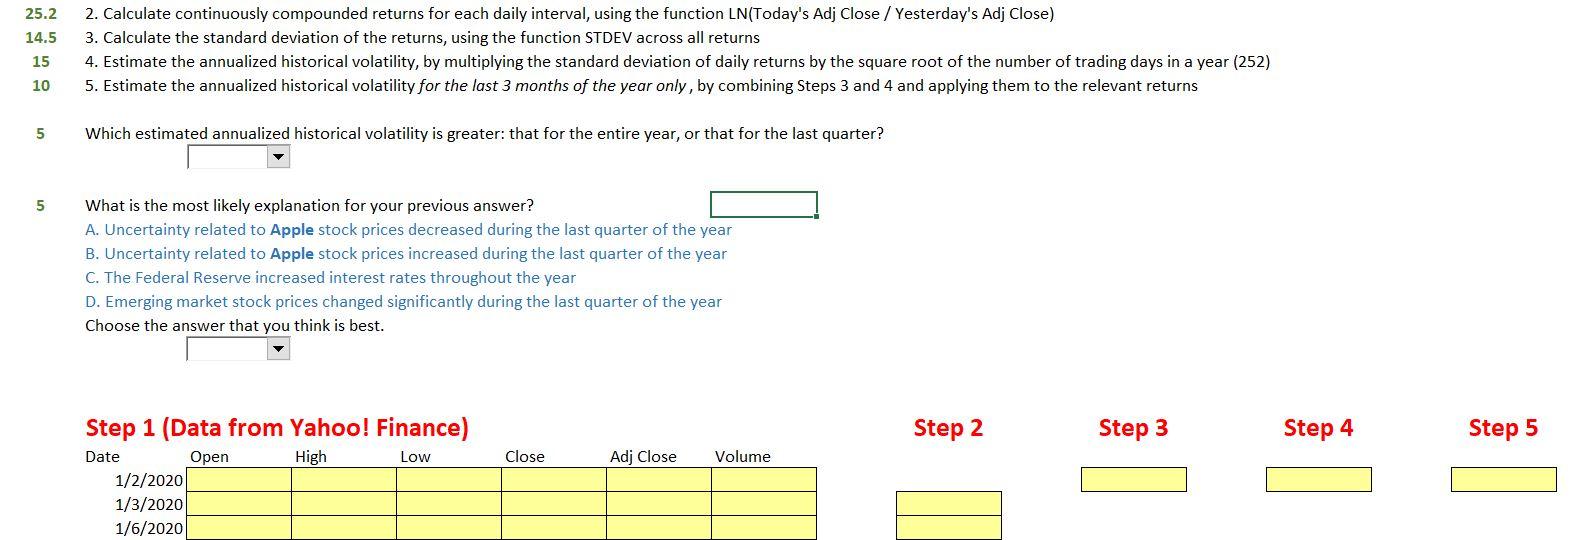
using yahoo finance historical data for Apple; set the time period to 12/31/2019 to 12/31/2020 and set the frequency to daily.

25.2 14.5 2. Calculate continuously compounded returns for each daily interval, using the function LN(Today's Adj Close / Yesterday's Adj Close) 3. Calculate the standard deviation of the returns, using the function STDEV across all returns 4. Estimate the annualized historical volatility, by multiplying the standard deviation of daily returns by the square root of the number of trading days in a year (252) 5. Estimate the annualized historical volatility for the last 3 months of the year only, by combining Steps 3 and 4 and applying them to the relevant returns 15 10 5 Which estimated annualized historical volatility is greater that for the entire year, or that for the last quarter? 5 What is the most likely explanation for your previous answer? A. Uncertainty related to Apple stock prices decreased during the last quarter of the year B. Uncertainty related to Apple stock prices increased during the last quarter of the year C. The Federal Reserve increased interest rates throughout the year D. Emerging market stock prices changed significantly during the last quarter of the year Choose the answer that you think is best. Step 2 Step 3 Step 4 Step 5 High Close Adj Close Volume Step 1 (Data from Yahoo! Finance) Date Open Low 1/2/2020 1/3/2020 1/6/2020 25.2 14.5 2. Calculate continuously compounded returns for each daily interval, using the function LN(Today's Adj Close / Yesterday's Adj Close) 3. Calculate the standard deviation of the returns, using the function STDEV across all returns 4. Estimate the annualized historical volatility, by multiplying the standard deviation of daily returns by the square root of the number of trading days in a year (252) 5. Estimate the annualized historical volatility for the last 3 months of the year only, by combining Steps 3 and 4 and applying them to the relevant returns 15 10 5 Which estimated annualized historical volatility is greater that for the entire year, or that for the last quarter? 5 What is the most likely explanation for your previous answer? A. Uncertainty related to Apple stock prices decreased during the last quarter of the year B. Uncertainty related to Apple stock prices increased during the last quarter of the year C. The Federal Reserve increased interest rates throughout the year D. Emerging market stock prices changed significantly during the last quarter of the year Choose the answer that you think is best. Step 2 Step 3 Step 4 Step 5 High Close Adj Close Volume Step 1 (Data from Yahoo! Finance) Date Open Low 1/2/2020 1/3/2020 1/6/2020


