

Question
USING YOUR ON SETTING 5. Use demand theory to create an overall market demand curve by aggregating the demand curves for two types of individual

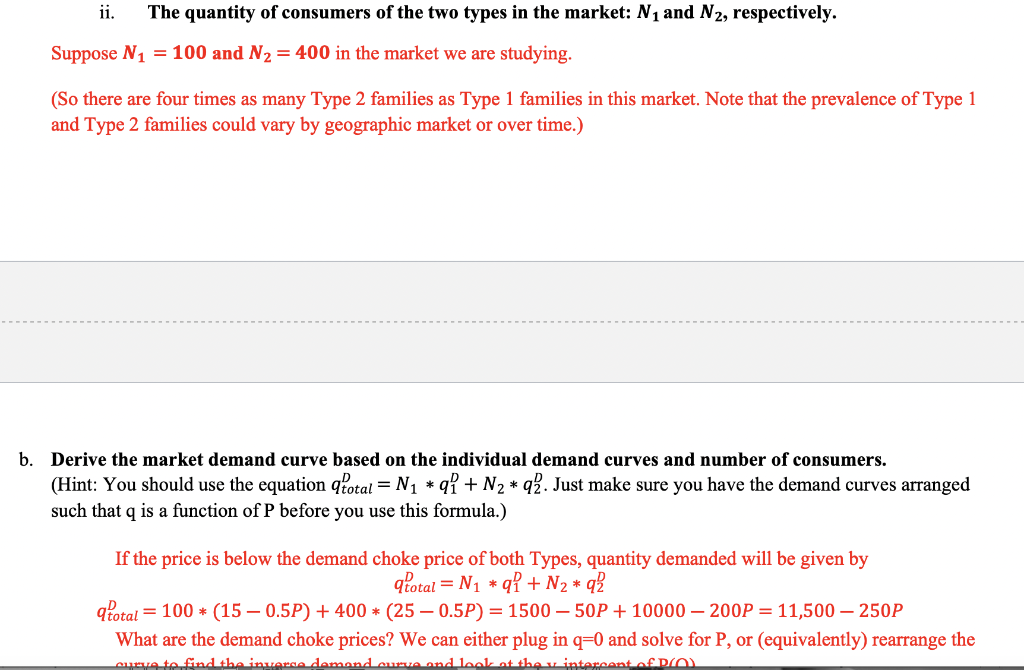

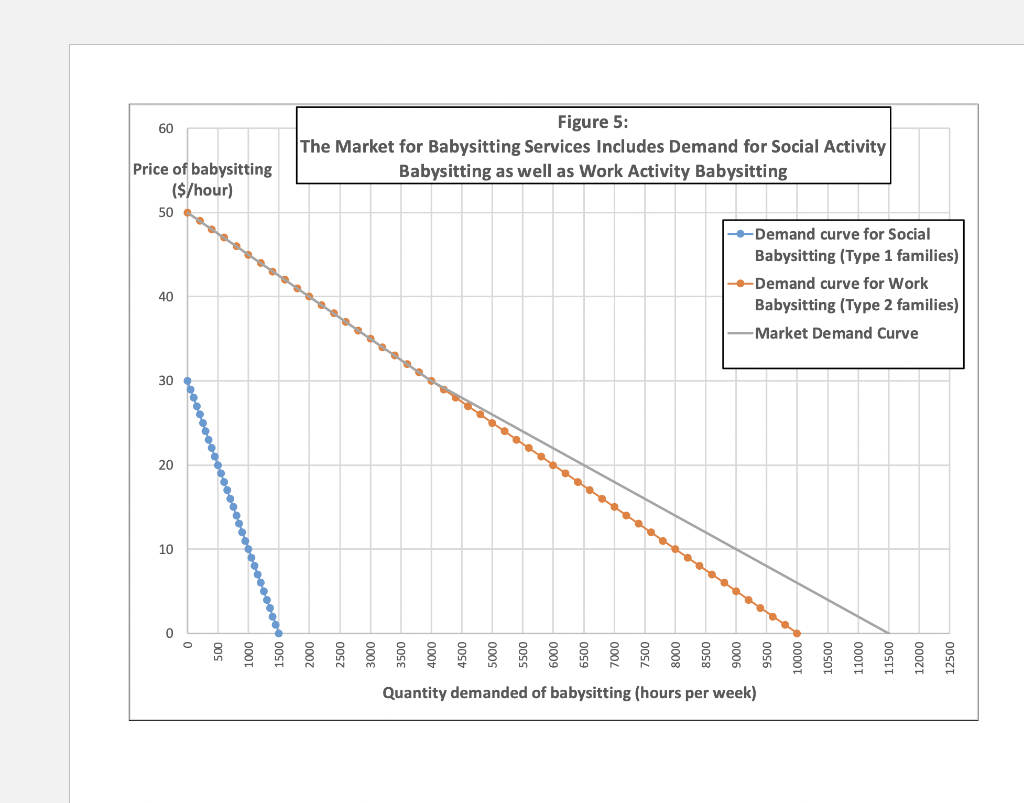
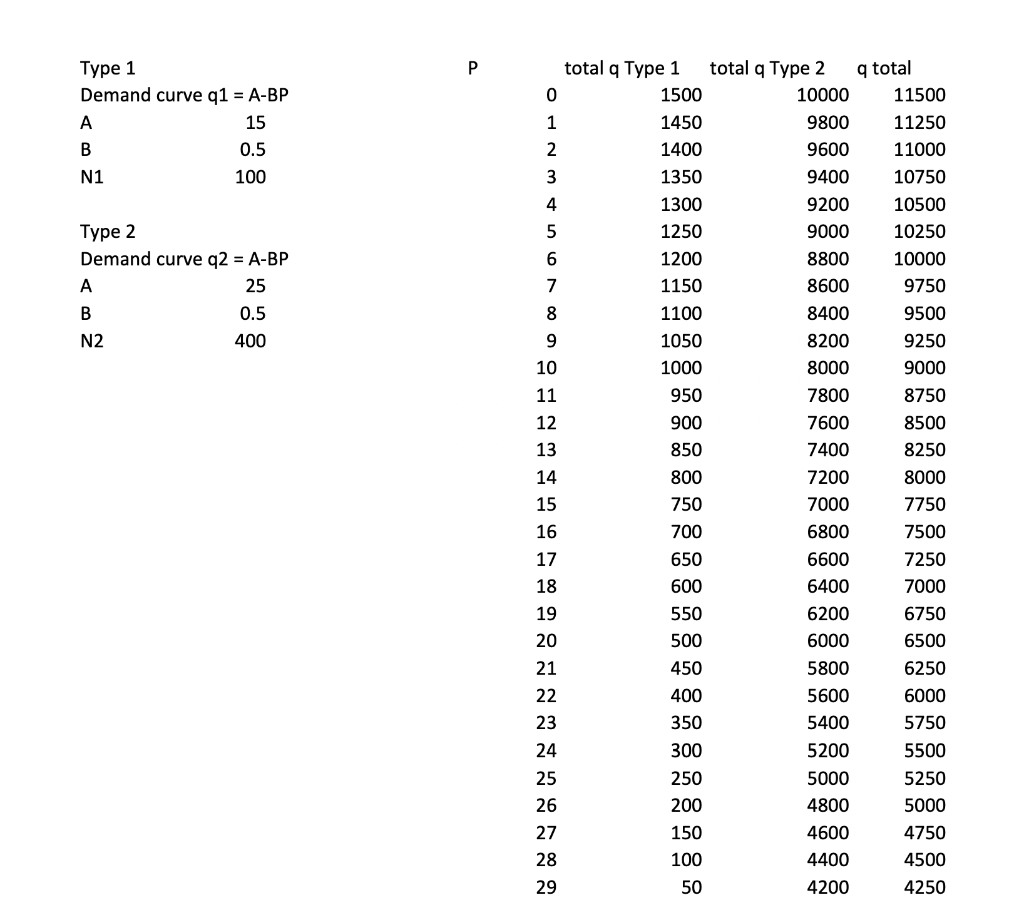
USING YOUR ON SETTING 5. Use demand theory to create an overall market demand curve by aggregating the demand curves for two types of individual consumers. There are three steps to this analysis. Required items are noted in bold. Hint: see Problem Set 7 - Question 5 example for a worked-out example. a. Assume that there are two types of consumers. Briefly describe two consumer types, and for each, specify: (6 points total) i. Assume a linear demand curve for an individual consumer of this type (by linear, I mean having the form = with some specific numbers A > 0 and B > 0). Ungraded suggestion: Coming up with reasonable assumptions for the slope and intercept terms in your linear demand functions does not have to be hard. See the final slide called Optional material for Question #5: How to calibrate (that is, come up with some reasonable numerical assumptions for) linear demand curves. ii. Assume the quantity of consumers of the two types in the market: and , respectively. b. Derive the market demand curve based on the individual demand curves and number of consumers. (4 points) (Hint: You should use the equation = 1 1 + 2 2 . Just make sure you have the demand curves arranged such that q is a function of P before you use this formula.) c. Create a graph of the market demand curve. (4 points) Label this graph Figure 5 and include a descriptive Title in the label. (E.g., The market for childrens apparel consists of price-sensitive parents and less price-sensitive gift-givers) Ungraded suggestion: Use this question as an opportunity to think about the different types of buyers for the product you are studying. They probably have different income levels, substitution possibilities, and tastes. Consider how these differences would cause differences in the shapes of their demand curves.
Problem Set #7 (Using the Consumer Behavior Model) An Example Solution for Question #5: a numerical demand curve with two market segments 5. Use demand theory to create an overall market demand curve by aggregating the demand curves for two types of individual consumers. There are three steps to this analysis: a. Assume that there are two types of consumers. Briefly describe two consumer types... Suppose in the market for babysitting services there are two types of families. Type 1 families hire babysitters so that the parents can go to social activities. Type 2 families hire babysitters so that the parents can go to work. Type 2 families will have relatively higher willingness to pay (greater price at a given quantity on the demand curve) and relative more inelastic demand. ... and for each, specify: i. A linear demand curve for an individual consumer of this type (by linear, I mean having the form qD = A - BP with some specific numbers A> 0 and B> 0). Let's measure quantity of babysitting services demanded in hours per week. The price is $ per hour. - First approximate or "calibrate a Type 1 demand curve. One approach to do that is to assume two points: Assume that P=20 qD=5. (At a price of $20/hour, Type 1 families demand 5 hours of babysitting per week.) Assume that P=22 q=4. (At a price of $22/hour, Type 1 families demand 4 hours of babysitting per week.) Fitting a straight line through these points means solving for the A and B such that q = A - BP: i. The implied value of B, the opposite of the demand curve slope, is equal to -(change in qP)/(change in P) = (4-5) (22-20) = (Note you could also have done q=A+BP and then B would be -0.5.) ii. The implied value of A, the demand curve intercept, must satisfy q = A -P for both points. If it works for one point it will work for the other (since the value of B = 2 is fixed). So 5 =A-0.5*20 A=5+10 = 15. (We could verify the other point is also on this line: 4 = 15-0.5*22= 15-11. Yep.) iii. Given these two points and assumption of linearity, the Type 1 demand curve is: q = 15 -0.5P (Note that it would be acceptable to go straight to assuming a function for the line, instead of assuming the two points and then finding the line. The extra step of calibration is not required.) Then approximate or "calibrate" a Type 2 demand curve. Using same approach, assume two points: - Assume that P=20 q=15. (At a price of $20/hour, Type 1 families demand 15 hours of babysitting per week.) Assume that P=22 qP=14. (At a price of $22/hour, Type 1 families demand 14 hours of babysitting per week.) Fitting a straight line through these points means solving for the A and B such that q = A - BP ... i. The implied value of B, the opposite of the demand curve slope, is equal to -(change in qP)/(change in P) = (14-15) == (22-20) ii. The implied value of A, the demand curve intercept, must satisfy q = A -P for both points. If it works for one point it will work for the other (since the value of B = 2 is fixed). So 15 = A-0.5*20 A=15+10=25. (We could verify the other point is also on this line: 25= 15-0.5*22=15-11. Yep.) iii. Given these two points and assumption of linearity, the Type 2 demand curve is: q2 = 25 -0.5P ii. The quantity of consumers of the two types in the market: N and N2, respectively. Accessibility: Investigate edictions: On 11. The quantity of consumers of the two types in the market: N and N2, respectively. Suppose N = 100 and N = 400 in the market we are studying. (So there are four times as many Type 2 families as Type 1 families in this market. Note that the prevalence of Type 1 and Type 2 families could vary by geographic market or over time.) b. Derive the market demand curve based on the individual demand curves and number of consumers. (Hint: You should use the equation qtotal = N * q + N * q2. Just make sure you have the demand curves arranged such that q is a function of P before you use this formula.) If the price is below the demand choke price of both Types, quantity demanded will be given by qtotal = N * q + N * q2 a total = 100* (15-0.5P) + 400* (25-0.5P) = 1500-50P+10000-200P = 11,500-250P What are the demand choke prices? We can either plug in q=0 and solve for P, or (equivalently) rearrange the curve to find the inverse demand curve and look at the u intercent of P/O) b. Derive the market demand curve based on the individual demand curves and number of consumers. (Hint: You should use the equation qtotal = N * q + N * q2. Just make sure you have the demand curves arranged such that q is a function of P before you use this formula.) If the price is below the demand choke price of both Types, quantity demanded will be given by qtotal = N * q + N * q? total= 100* (15-0.5P) + 400* (25-0.5P) = 1500-50P+10000-200P = 11,500 - 250P What are the demand choke prices? We can either plug in q=0 and solve for P, or (equivalently) rearrange the curve to find the inverse demand curve and look at the y-intercept of P(Q). Approach 1: solve for P when q=0 q=15-0.5P = 0-15 = -0.5P+P = 30 q2 = 25-0.5P = 0-25=-0.5P+P = 50 Approach 2: find inverse demand curve equations q=15-0.5Pq-15=-0.5P+P = -2q +30P=30-2q. Intercept is 30. q2 = 25-0.5P-q2-25=-0.5P-P=2q2 +50P=50-2q2. Intercept is 50. When the price is below 30, both consumers Types have positive quantity demanded. When price is above 30 (but less than 50), only Type 2 consumers have positive quantity demanded. So the market demand curve is 0 total= 10,000-200P (11,500-250P if P > 50 if 50 P 30 if P 50.) c. A graph which depicts three demand curves: demand for type 1 consumers, in total; demand for type 2 consumers, in total, and demand for the overall market. Label this graph Figure 5 and include a descriptive Title in the label. (E.g., "The market for children's apparel consists of price-sensitive parents and less price-sensitive gift-givers") In equation form, the demand curve for type 1 consumers, in total, is q_total = N * q = 100* (15-0.5P) = 1500-50P. For the graph, the x-intercept, which we find by plugging P = 0 into the demand curve, is qi_total = 1500. The y-intercept is the demand choke price of all type 1 consumers (P-30). We could also find this by plugging Q = 0 into the demand curve: q_total = 0 = 1500-50P-1500 = 50PP = 30. In equation form, the demand curve for type 2 consumers, in total, is 92_total = N * q2 = 400* (25-0.5P) = 10,000 - 200P. For the graph, the x-intercept, which we find by plugging P = 0 into the demand curve, is q2_total = 10,000. 60 Price of babysitting ($/hour) 50 40 30 20 10 0 500 1000 OOST Figure 5: The Market for Babysitting Services Includes Demand for Social Activity Babysitting as well as Work Activity Babysitting --Demand curve for Social Babysitting (Type 1 families) --Demand curve for Work Babysitting (Type 2 families) -Market Demand Curve 2000 2500 3000 M www Quantity demanded of babysitting (hours per week) 9500 10000 10000 10500 11000 11500 12000 12500 Type 1 Demand curve q1 = A-BP A 15 B 0.5 N1 100 Type 2 Demand curve q2 = A-BP A 25 B 0.5 N2 400 P 0 1 2 3 4 5 6 7 8 9 10 11 12 13 GELARGONNENHUNG 14 15 16 17 18 19 20 21 22 23 24 25 26 27 28 29 total q Type 1 1500 1450 1400 1350 1300 1250 1200 1150 1100 1050 1000 950 900 850 800 750 700 650 600 550 500 450 400 350 300 250 200 150 100 50 total q Type 2 10000 9800 9600 9400 9200 9000 8800 8600 8400 8200 8000 7800 7600 7400 7200 7000 6800 6600 6400 6200 6000 5800 5600 5400 5200 5000 4800 4600 4400 4200 q total 11500 11250 11000 10750 10500 10250 10000 9750 9500 9250 9000 8750 8500 8250 8000 7750 7500 7250 7000 6750 6500 6250 6000 5750 5500 5250 5000 4750 4500 4250Step by Step Solution
There are 3 Steps involved in it
Step: 1

Get Instant Access to Expert-Tailored Solutions
See step-by-step solutions with expert insights and AI powered tools for academic success
Step: 2

Step: 3
Ace Your Homework with AI
Get the answers you need in no time with our AI-driven, step-by-step assistance
Get Started
The Almanack Of Stanley Druckenmiller From Over 40 Years Of Investing Wisdom With Quantum Fund And Duquesne Capital Management
Authors: Rui Zhi Dong
1st Edition
B0B3NV2H9M, 979-8850611453